Using your own Grafana with Cockpit
In this tutorial, you will learn how to use your own Grafana with Scaleway's Cockpit service. In this tutorial, we are using Grafana version 9.5.1.
Before you start
To complete the actions presented below, you must have:
- A Scaleway account logged into the console
- Owner status or IAM permissions allowing you to perform actions in the intended Organization
- Installed Docker
- Downloaded the latest version of Grafana
Launching Grafana
-
Run the following command to launch Grafana in a Docker container on your local machine:
docker run -d -p 3000:3000 grafana/grafana-oss:9.5.1 -
Create a token with the following permissions:
- Query metrics
- Query logs
- Query traces
- Rules for metrics
- Rules for logs
- Alerts
-
Copy your token's secret key as you will need it for the following steps.
-
Open http://localhost:3000 in a web browser on your local computer to access Grafana.
-
Sign up using
adminas your username and password. You will then be prompted to change your password.
Creating your data source for metrics
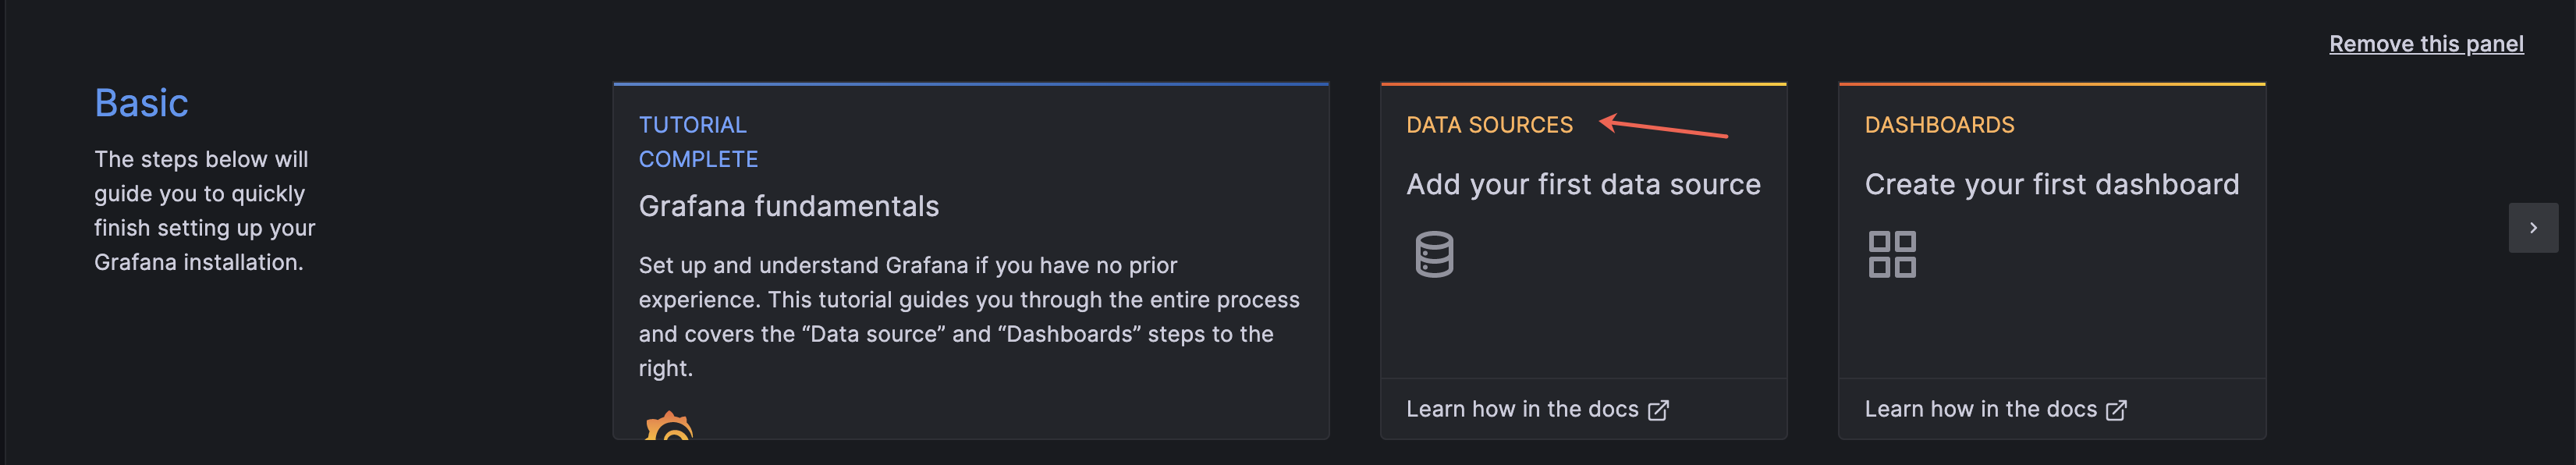
- From the Grafana homepage, click Add your first data source.
- Select the Prometheus data source in the list that displays.
- Retrieve the URL of the metrics data source you want to add from the Data sources tab of the Scaleway console. Make sure that the region in the URL is the one where your data source is located.
- Add
/prometheusat the end of the URL. Your metrics' URL should look like the following:https://xxxxxxxx-xxxx-xxxx-xxxx-xxxxxxxxxxxx.metrics.cockpit.fr-par.scw.cloud/prometheus - Paste your metrics' URL in the URL field of the HTTP section.
- From the Custom HTTP Headers section, click + Add header.
- Enter
X-Tokenin the Header field. - Enter your token's secret key in the Value field.
- From the Type and version section, select Prometheus in the Prometheus type drop-down.
- Select the latest version in the Prometheus version drop-down.
- Click Save & test to confirm.
Creating your data source for logs
- From the Grafana homepage, click Add your first data source.
- Select the Loki data source in the list that displays.
- Retrieve the URL of the logs data source you want to add from the Data sources tab of the Scaleway console.
- Paste your logs' URL in the URL field of the HTTP section.
- From the Custom HTTP Headers section, click + Add header.
- Enter
X-Tokenin the Header field. - Enter your token's secret key in the Value field.
- Click Save & test to confirm.
Creating your data source for your Alert manager
- From the Grafana homepage, click Add your first data source.
- Select the Alertmanager data source.
- In the Alertmanager section > Implementation, select Mimir in the drop-down.
- Copy and paste the following URL in the URL field of the HTTP section:
https://alertmanager.cockpit.fr-par.scw.cloud - From the Custom HTTP headers section, click + Add header.
- Enter
X-Tokenin the Header field. - Enter your token's secret key in the Value field.
- Click Save & test to confirm.
Creating your data source for your traces
- From the Grafana homepage, click Add your first data source.
- Select the Tempo data source in the list that displays.
- Retrieve the URL of the traces data source you want to add from the Data sources tab of the Scaleway console.
- Paste your logs' URL in the URL field of the HTTP section.
- From the Custom HTTP headers, click + Add header.
- Enter
X-Tokenin the Header field. - Enter your token's secret key in the Value field.
- Click Save & test to confirm.
Questions?
Visit our Help Center and find the answers to your most frequent questions.
Visit Help Center