Pushing metrics and logs from a Scaleway Instance
This page shows you how to push your metrics and logs from a Scaleway Instance. You can also use this tutorial to push metrics and logs from external Instances (i.e. Instances outside of Scaleway).
Before you start
To complete the actions presented below, you must have:
- A Scaleway account logged into the console
- Owner status or IAM permissions allowing you to perform actions in the intended Organization
Configure your environment
-
Create an Instance from the Compute section of the Scaleway console.
-
Copy your Instance's public IP as you will need it in the next steps.
-
Open a terminal and type the following command to connect to your Instance:
ssh root@<your Instance public IP>
Clone the GitHub repository
We have created a GitHub repository that contains all the code you need to configure the Grafana agent, to push your data.
Files in the directory
The tuto-cockpit-instance directory contains a workshop folder with several files inside of it:
download.shis a script responsible for downloading the necessary binaries and tools you need for the monitoring setup. It fetches the Grafana agent, for example.agent.yamlis the Grafana agent configuration file responsible for collecting metrics and logs from your data sources, and pushing them to your Cockpit.docker-compose.yamlis the Docker compose configuration filesetup.shensures that all dependencies required for monitoring are properly installed and configurednginx.confspecifies server settingsrun.shexecutes the Grafana agent with the specified configuration file (agent.yaml).
The only file we will be editing in this tutorial is the agent.yaml file to add your Cockpit token.
-
Open another terminal and type the following command to clone our
tuto-cockpit-instancedirectory on your local machine:git clone git@github.com:scaleway/tuto-cockpit-instance.git -
In the same terminal, run the following command to send the
tuto-cockpit-instancedirectory and its content into your Instance:scp -r tuto-cockpit-instance root@<your Instance public IP>:~/ -
Make sure the
tuto-cockpit-instancedirectory is inside your Instance with the following command:ls -
Access the
workshopfolder insidetuto-cockpit-instance, using the following command:cd tuto-cockpit-instance/workshop -
Install Golang on your Instance using the following commands:
wget https://github.com/grafana/agent/releases/download/v0.34.3/grafana-agent-0.34.3-1.amd64.deb sudo tar -C /usr/local/ -xzf go1.20.linux-amd64.tar.gz -
Run the following command to set Golang in your environment:
export PATH=$PATH:/usr/local/go/bin -
Run the following command to install docker. Docker allows you to run the
docker-compose.yamlfile.apt install docker.io -
Run the following command to unzip the files in the
workshopfolder:sudo apt-get install zip unzip
Configure the Grafana agent file and push your data
- Generate a token and select the push permissions for metrics and logs. Make note of your token's secret key, as you will need it in the following steps.
- In the same terminal where you are connected to your Instance, run the following command to download the Grafana agent:
bash ./download.sh - Run
vim agent.yamlto access the Grafana agent configuration file. - Type
ito edit the file. - Add your token's secret key next to
X-Tokenin themetricssection. - Add your token's secret key next to
tenant_idin thelogssection. - Press
escape,:wq, andEnterto save and exit the file. - Run the following command to launch the Grafana agent:
bash ./run.sh
Visualize your metrics and logs
-
Log in to the Scaleway console and click Cockpit in the side menu.
-
Click Open dashboards in the top right corner of your screen.
-
Log in to Grafana using your credentials.
-
Click the downward pointing arrow in the top right corner of your screen and select Import dashboard.
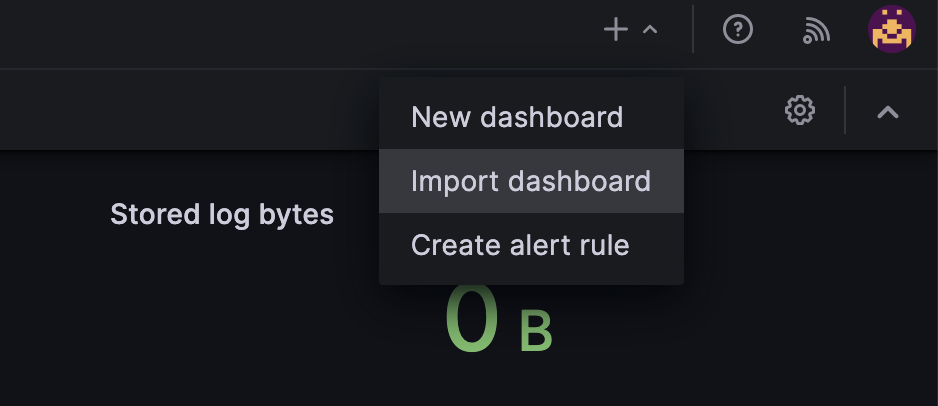
-
Paste the following dashboard ID
12486in the Import via grafana.com section and click Load. Alternatively, download the dashboard's JSON template and upload it in the Import dashboard section. -
Click Import.
-
Configure your dashboard as you please.
-
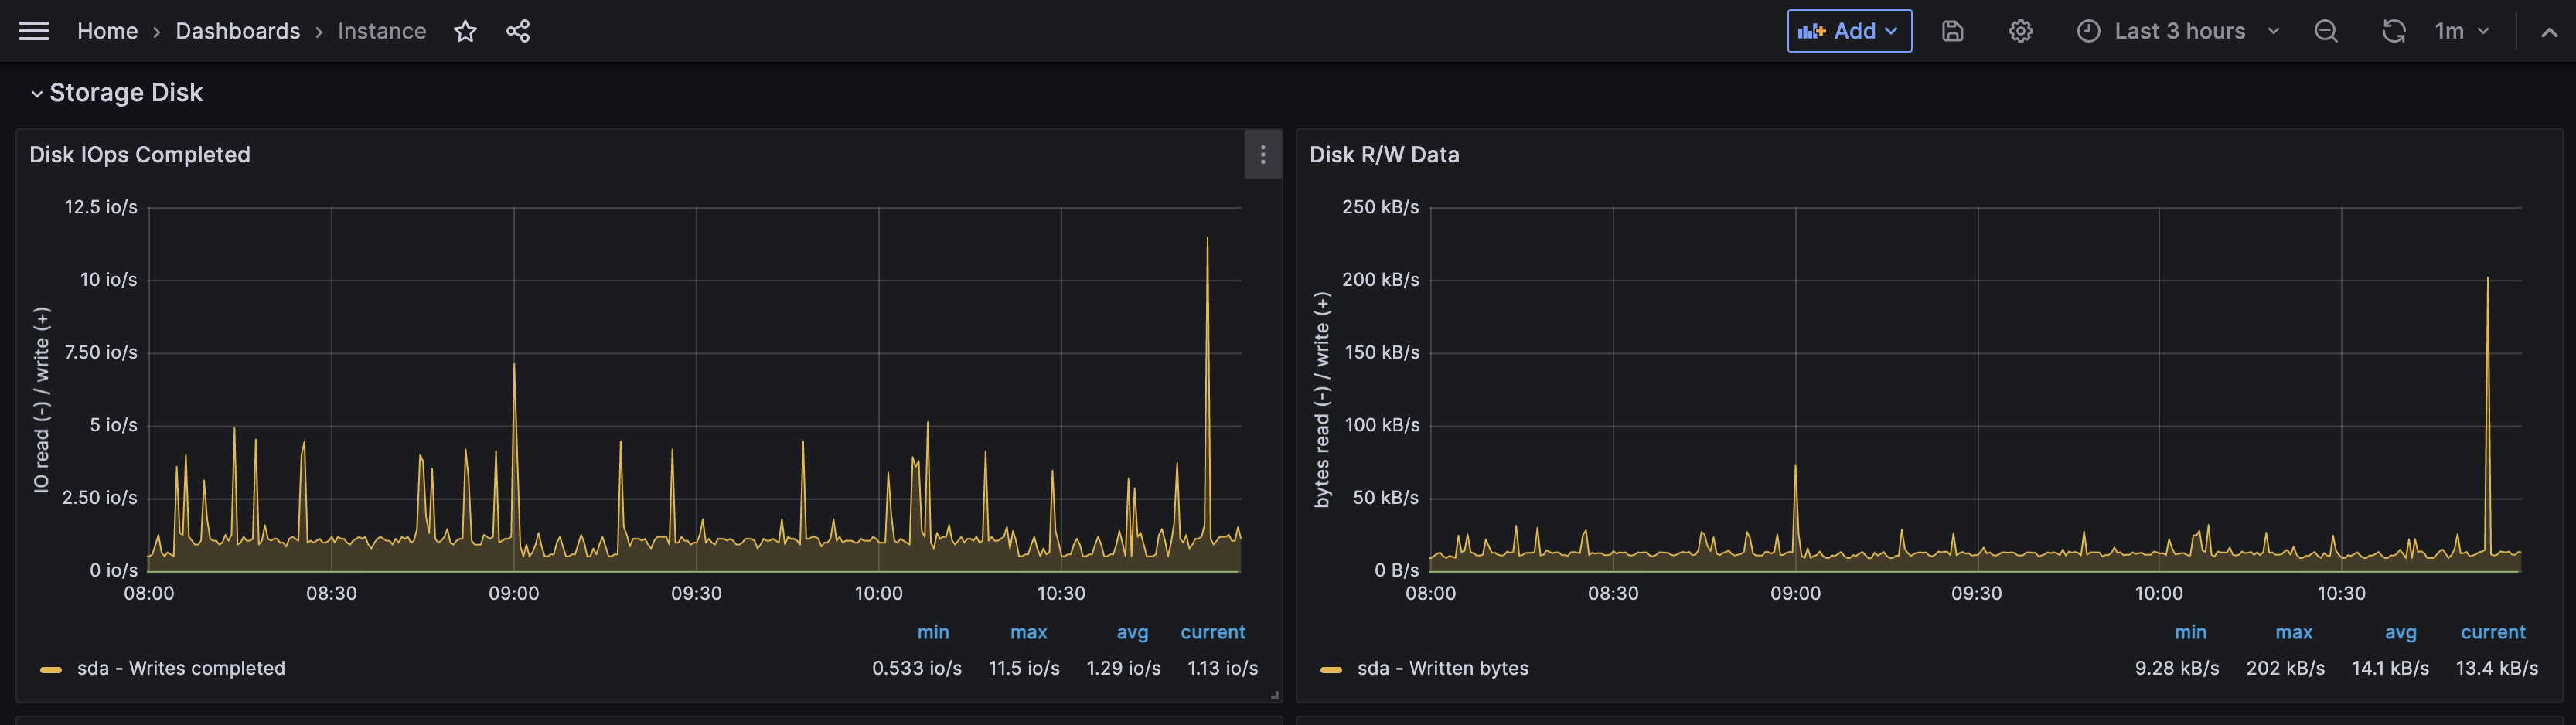
Select Scaleway metrics in the drop-down box and click Import.
Your metrics should display in the dashboard.
-
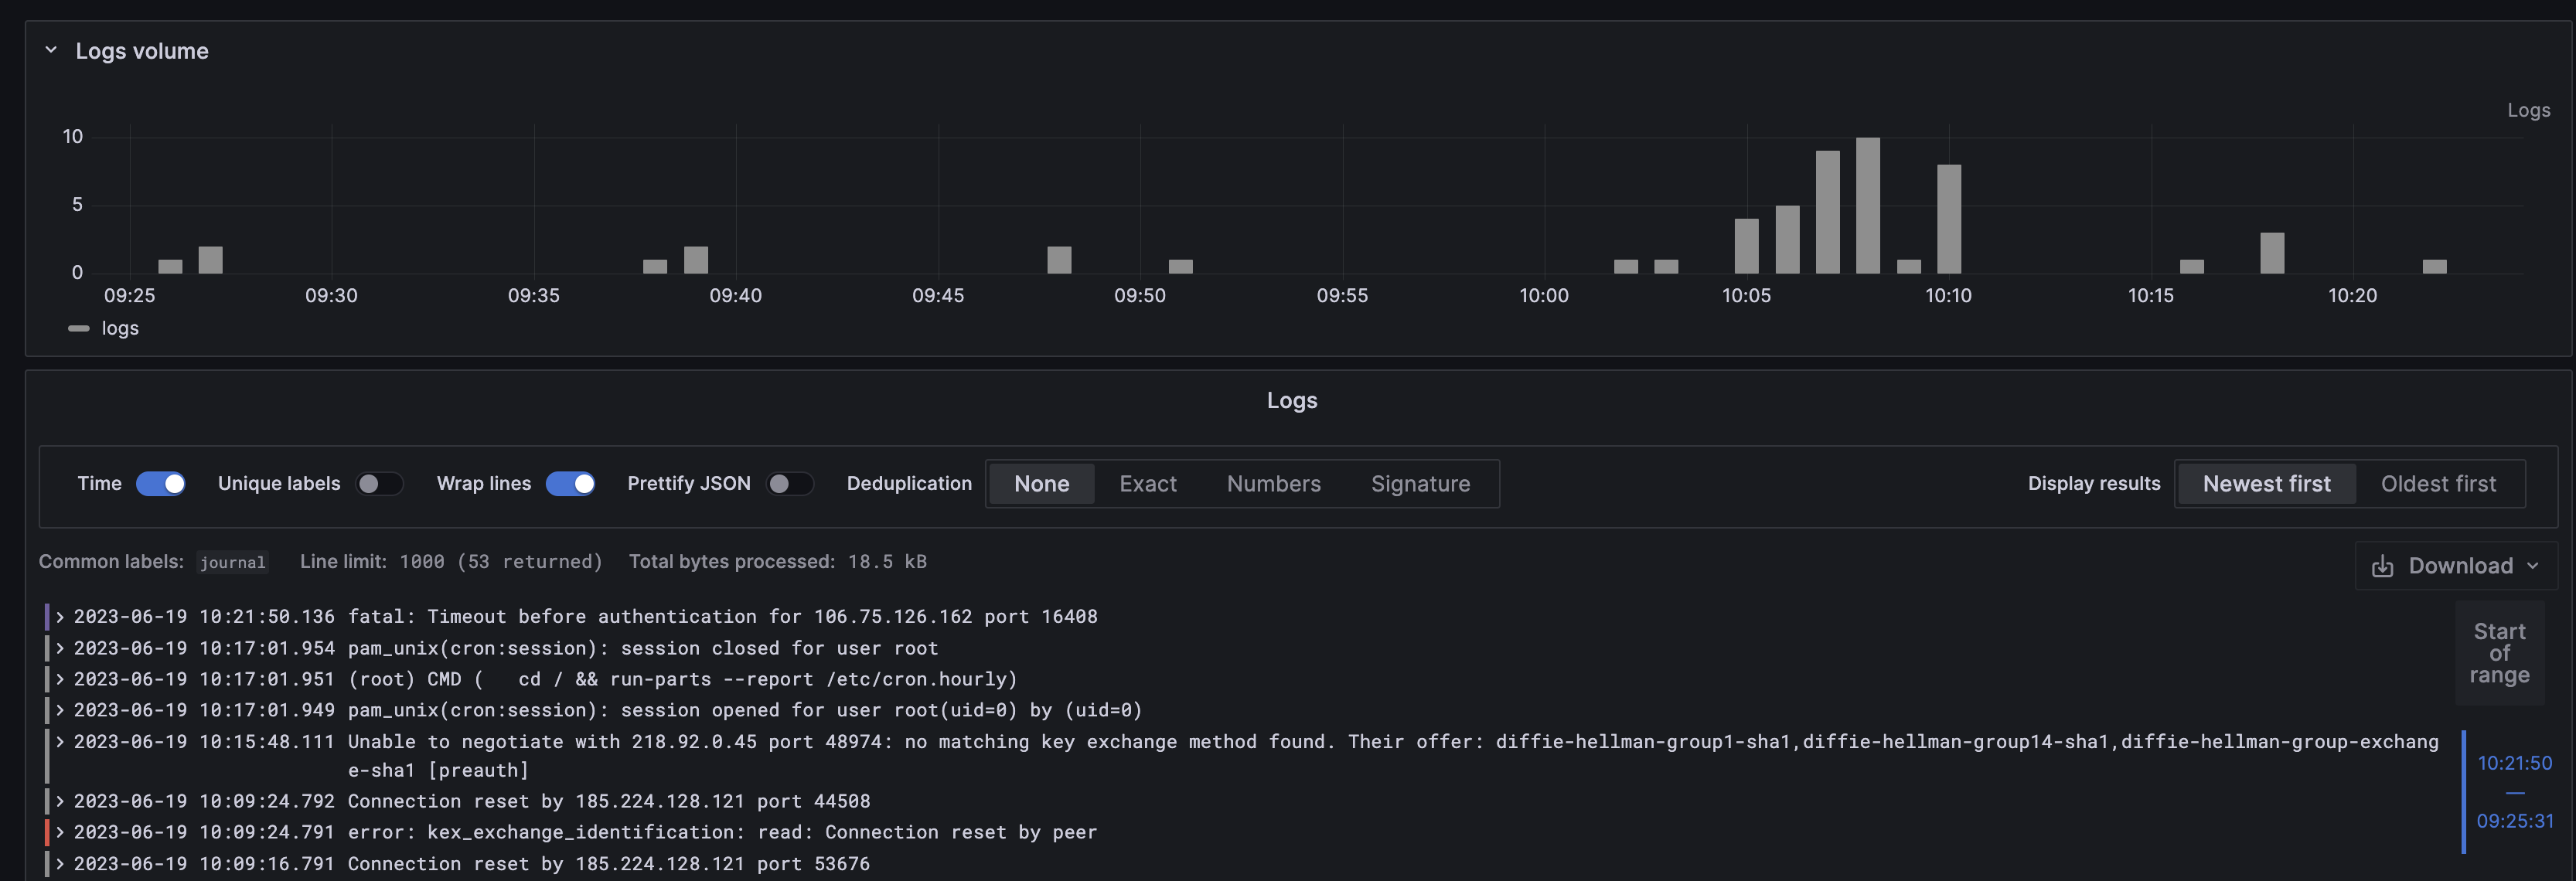
Click Toggle menu and Explore.
-
Select the labels you want to apply in the Label filters section.
-
Click Run query in the top right corner of your screen. Your logs should display.
Visit our Help Center and find the answers to your most frequent questions.
Visit Help Center