How to send logs from your Kubernetes cluster to your Cockpit
Follow this procedure to send application logs from your Kubernetes cluster to your Cockpit. You can use Helm directly, or deploy the Helm chart with Terraform or OpenTofu.
You will use the k8s-monitoring Helm chart, which installs an Alloy Daemon set to export the logs of your Kubernetes cluster to your Cockpit.
Before you start
To complete the actions presented below, you must have:
- A Scaleway account logged into the console
- Owner status or IAM permissions allowing you to perform actions in the intended Organization
- Created a custom data source of type Logs
- Created a Cockpit token in the same region as the data source of the logs
- A running Kubernetes cluster containing your deployed application
- Created an API key and retrieved your API secret key
- Installed Helm
Configure the Helm chart
Create a values.yml file to configure your Helm chart to send logs from your Kubernetes cluster to Cockpit, using the following example.
The example Helm chart can be configured to send both logs and metrics to your Cockpit. In this article, we are interested in the logs part only. For information about setting up metrics collection, see the sending metrics from your Kubernetes cluster to Cockpit article.
Ensure that you replace:
CHANGE_ME_CLUSTER_NAMEwith the name of your Scaleway Kubernetes clusterCHANGE_ME_LOGS_PUSH_URLwith the URL of your custom log data source (you can find it under the "API URL" section in the Data sources tab of the Scaleway console)CHANGE_ME_TOKEN(undercockpit-logs) with your Cockpit token
# Grafana k8s-monitoring Helm chart values for Scaleway Cockpit

cluster:
  name: CHANGE_ME_CLUSTER_NAME

global:
  scrapeInterval: 60s

destinations:
  cockpit-metrics:
    type: prometheus

    metrics:
      enabled: true
    logs:
      enabled: false
    traces:
      enabled: false

    url: CHANGE_ME_METRICS_PUSH_URL/api/v1/push
    tenantId: CHANGE_ME_TOKEN

    queueConfig:
      sampleAgeLimit: 1h

  cockpit-logs:
    type: loki

    metrics:
      enabled: false
    logs:
      enabled: true
    traces:
      enabled: false

    url: CHANGE_ME_LOGS_PUSH_URL/loki/api/v1/push
    tenantId: CHANGE_ME_TOKEN

clusterMetrics:
  enabled: true
  destinations: ["cockpit-metrics"]
  collector: metrics-collector

  nodeLabels:
    nodePools: true
    regions: true
    availabilityZone: true
    instanceType: true

  # Already included in Scaleway data source
  controlPlane:
    enabled: false

  kubelet:
    enabled: true
    metricsTuning:
      useDefaultAllowList: false
      useIntegrationAllowList: false
      includeMetrics:
        # Volume statistics metrics required by Grafana dashboards
        - kubelet_volume_stats_capacity_bytes
        - kubelet_volume_stats_inodes
        - kubelet_volume_stats_inodes_used
        - kubelet_volume_stats_used_bytes

  kubeletResource:
    enabled: true
    # Adjustments to the scraped metrics to filter the amount of data sent to storage
    metricsTuning:
      useDefaultAllowList: false
      useIntegrationAllowList: false
      includeMetrics:
        - node_cpu_usage_seconds_total
        - node_memory_working_set_bytes

  kubeletProbes:
    enabled: false

  cadvisor:
    enabled: true
    metricsTuning:
      useDefaultAllowList: false
      includeMetrics:
        # Container metrics required by Grafana dashboards
        - container_cpu_cfs_throttled_seconds_total
        - container_cpu_usage_seconds_total
        - container_memory_working_set_bytes
        - container_network_receive_bytes_total
        - container_network_receive_errors_total
        - container_network_receive_packets_dropped_total
        - container_network_receive_packets_total
        - container_network_transmit_bytes_total
        - container_network_transmit_errors_total
        - container_network_transmit_packets_dropped_total
        - container_network_transmit_packets_total
        - container_oom_events_total
        # Machine metrics
        - machine_cpu_cores
        - machine_memory_bytes

  # Already included in Scaleway data source
  apiServer:
    enabled: false

  kubeControllerManager:
    enabled: false

  kubeDNS:
    enabled: false

  kubeProxy:
    enabled: false

  kubeScheduler:
    enabled: false

  kube-state-metrics:
    enabled: true
    metricsTuning:
      useDefaultAllowList: false
      includeMetrics:
        # Kubernetes state metrics required by Grafana dashboards
        - kube_configmap_info
        - kube_daemonset_labels
        - kube_deployment_labels
        - kube_deployment_status_replicas_available
        - kube_deployment_status_replicas_unavailable
        - kube_endpoint_info
        - kube_hpa_labels
        - kube_ingress_info
        - kube_namespace_created
        - kube_namespace_labels
        - kube_networkpolicy_labels
        - kube_node_info
        - kube_persistentvolumeclaim_info
        - kube_pod_container_info
        - kube_pod_container_resource_limits
        - kube_pod_container_resource_requests
        - kube_pod_container_status_last_terminated_exitcode
        - kube_pod_container_status_last_terminated_reason
        - kube_pod_container_status_ready
        - kube_pod_container_status_restarts_total
        - kube_pod_container_status_running
        - kube_pod_container_status_terminated
        - kube_pod_container_status_waiting
        - kube_pod_info
        - kube_pod_status_phase
        - kube_pod_status_qos_class
        - kube_pod_status_reason
        - kube_secret_info
        - kube_service_info
        - kube_statefulset_labels

hostMetrics:
  enabled: true
  destinations: ["cockpit-metrics"]
  collector: metrics-collector

  linuxHosts:
    enabled: true
    # Adjustments to the scraped metrics to filter the amount of data sent to storage
    metricsTuning:
      useDefaultAllowList: false
      useIntegrationAllowList: false
      includeMetrics:
        # Node system metrics required by Grafana dashboards
        - node_context_switches_total
        - node_cpu_core_throttles_total
        - node_cpu_seconds_total
        - node_disk_io_now
        - node_disk_read_bytes_total
        - node_disk_reads_completed_total
        - node_disk_writes_completed_total
        - node_disk_written_bytes_total
        - node_filefd_allocated
        - node_filefd_maximum
        - node_filesystem_avail_bytes
        - node_filesystem_device_error
        - node_filesystem_files
        - node_filesystem_files_free
        - node_filesystem_size_bytes
        - node_intr_total
        - node_load1
        - node_load15
        - node_load5
        - node_uname_info
        - node_memory_Buffers_bytes
        - node_memory_Cached_bytes
        - node_memory_MemAvailable_bytes
        - node_memory_MemFree_bytes
        - node_memory_MemTotal_bytes
        - node_memory_SwapFree_bytes
        - node_memory_SwapTotal_bytes
        - node_netstat_Tcp_CurrEstab
        - node_network_receive_bytes_total
        - node_network_receive_drop_total
        - node_network_receive_errs_total
        - node_network_receive_packets_total
        - node_network_transmit_bytes_total
        - node_network_transmit_drop_total
        - node_network_transmit_errs_total
        - node_network_transmit_packets_total
        - node_nf_conntrack_entries
        - node_nf_conntrack_entries_limit
        - node_time_seconds
        - node_boot_time_seconds
        - node_timex_estimated_error_seconds
        - node_timex_maxerror_seconds

  windowsHosts:
    enabled: false

clusterEvents:
  enabled: true
  # We can use source : kubernetes-events instead
  # extraLogProcessingStages: |-
  #   stage.static_labels {
  #     values = {
  #       log_source = "clusterEvents",
  #     }
  #   }
  # labelsToKeep:
  # - job
  # - level
  # - namespace
  # - node
  # - source
  # - reason
  # - log_source
  destinations: ["cockpit-logs"]
  collector: events-collector

nodeLogs:
  enabled: true
  # We can use source : journal instead
  # extraLogProcessingStages: |-
  #   stage.static_labels {
  #     values = {
  #       log_source = "nodeLogs",
  #     }
  #   }
  # labelsToKeep:
  #  - instance
  #  - job
  #  - level
  #  - name
  #  - unit
  #  - service.name
  #  - source
  #  - log_source
  destinations: ["cockpit-logs"]
  collector: logs-collector

podLogsViaLoki:
  enabled: true
  staticLabels:
    source: "podLogs"
  # Add an indexed label containing the podname from structured metadata for ease of filtering in dashboards
  extraLogProcessingStages: |-
    stage.labels {
      values = {
        pod = "pod",
      }
    }
  destinations: ["cockpit-logs"]
  volumeGatherSettings:
    onlyGatherNewLogLines: true
  # Filter pods at discovery level - only keep pods with the annotation `cockpit/logs=true`
  extraDiscoveryRules: |
    rule {
      source_labels = ["__meta_kubernetes_pod_annotation_cockpit_logs"]
      action = "keep"
      regex = "true"
    }

  # Copy Kubernetes Pod labels to log labels
  labels:
    app_kubernetes_io_name: app.kubernetes.io/name
    container: container
    instance: instance
    job: job
    level: level
    namespace: namespace
    service_name: service.name
    service_namespace: service.namespace
    deployment_environment: deployment.environment
    deployment_environment_name: deployment.environment.name
    k8s_namespace_name: k8s.namespace.name
    k8s_deployment_name: k8s.deployment.name
    k8s_statefulset_name: k8s.statefulset.name
    k8s_daemonset_name: k8s.daemonset.name
    k8s_cronjob_name: k8s.cronjob.name
    k8s_job_name: k8s.job.name
    k8s_node_name: k8s.node.name
    source: source
    pod: pod

  collector: logs-collector

podLogsViaKubernetesApi:
  enabled: false

applicationObservability:
  enabled: false

autoInstrumentation:
  enabled: false

annotationAutodiscovery:
  enabled: true
  destinations: ["cockpit-metrics"]
  annotations:
    # -- Annotation for enabling scraping for this service or pod. Value should be either "true" or "false"
    # @section -- Annotations
    scrape: "cockpit/metrics"
    # -- Annotation for overriding the job label
    # @section -- Annotations
    job: "cockpit/job"
    # -- Annotation for overriding the instance label
    # @section -- Annotations
    instance: "cockpit/instance"
    # -- Annotation for selecting the specific container to scrape
    # @section -- Annotations
    metricsContainer: "cockpit/metrics.container"
    # -- Annotation for setting or overriding the metrics path. If not set, it defaults to /metrics
    # @section -- Annotations
    metricsPath: "cockpit/metrics.path"
    # -- Annotation for setting the metrics port by name
    # @section -- Annotations
    metricsPortName: "cockpit/metrics.portName"
    # -- Annotation for setting the metrics port by number
    # @section -- Annotations
    metricsPortNumber: "cockpit/metrics.portNumber"
    # -- Annotation for setting the metrics scheme, default: http
    # @section -- Annotations
    metricsScheme: "cockpit/metrics.scheme"
    # -- Annotation for setting `__param_<key>` parameters when scraping
    # Example: `cockpit/metrics.param_key: "value"`
    # @section -- Annotations
    metricsParam: "cockpit/metrics.param"
    # -- Annotation for overriding the scrape interval for this service or pod. Value should be a duration like "15s, 1m"
    # Overrides metrics.autoDiscover.scrapeInterval
    # @section -- Annotations
    metricsScrapeInterval: "cockpit/metrics.scrapeInterval"
    # -- Annotation for overriding the scrape timeout for this service or pod. Value should be a duration like "15s, 1m"
    # Overrides metrics.autoDiscover.scrapeTimeout
    # @section -- Annotations
    metricsScrapeTimeout: "cockpit/metrics.scrapeTimeout"
  pods:
    staticLabels:
      metric_source: "podsAnnotationAutodiscovery"
  services:
    staticLabels:
      metric_source: "servicesAnnotationAutodiscovery"
  collector: metrics-collector

prometheusOperatorObjects:
  enabled: true
  destinations: ["cockpit-metrics"]
  probes:
    enabled: true
    labelSelector: |-
      match_expression {
        key = "cockpit/metrics"
        operator = "In"
        values = ["true", "on", "yes", "1"]
      }
    extraMetricProcessingRules: |-
      rule {
        target_label = "metric_source"
        replacement = "promObjectProbes"
        source_labels = []
      }

  podMonitors:
    enabled: true
    labelSelector: |-
      match_expression {
        key = "cockpit/metrics"
        operator = "In"
        values = ["true", "on", "yes", "1"]
      }
    extraMetricProcessingRules: |-
      rule {
        target_label = "metric_source"
        replacement = "promObjectPodMonitors"
        source_labels = []
      }

  serviceMonitors:
    enabled: true
    labelSelector: |-
      match_expression {
        key = "cockpit/metrics"
        operator = "In"
        values = ["true", "on", "yes", "1"]
      }
    extraMetricProcessingRules: |-
      rule {
        target_label = "metric_source"
        replacement = "promObjectServiceMonitors"
        source_labels = []
      }
  collector: metrics-collector

profiling:
  enabled: false

profilesReceiver:
  enabled: false

integrations:
  destinations: []
  collector: metrics-collector

selfReporting:
  enabled: false

collectors:
  metrics-collector:
    presets: [clustered, statefulset]
  logs-collector:
    presets: [filesystem-log-reader, daemonset]
  events-collector:
    presets: [singleton]

collectorCommon:
  alloy:
    alloy:
      logging:
        level: info
        format: logfmt
      # Easier debug, but consumes more resources
      liveDebugging:
        enabled: false
      enableReporting: false

telemetryServices:
  kube-state-metrics:
    deploy: true
  node-exporter:
    deploy: true
  windows-exporter:
    deploy: false
  kepler:
    deploy: false
  opencost:
    deploy: false

alloy-operator:
  deploy: true

extraObjects: []Send Kubernetes logs using Helm chart
Once you have configured your values.yml file, you can use Helm to deploy the log-forwarding configuration to your Kubernetes cluster.
Before installing the Helm chart, ensure that your kubectl tool is properly connected to your Kubernetes cluster. kubectl is the command-line tool for interacting with Kubernetes clusters.
-
Run the following commands to install the
k8s-monitoringHelm chart.Ensure that you replace:
-
/your-path/to/values.ymlwith the correct path where yourvalues.ymlfile is stored -
name-of-your-choice-for-your-log-ingesterwith a clear name (e.g.,alloy-logs-ingester)helm repo add grafana https://grafana.github.io/helm-charts helm repo update helm install -f /your-path/to/values.yml name-of-your-choice-for-your-log-ingester grafana/k8s-monitoring --version 4.5.0The
-fflag specifies the path to yourvalues.ymlfile, which contains the configuration for the Helm chart.
Helm installs thek8s-monitoringchart, which includes the Alloy DaemonSet configured to collect logs from your Kubernetes cluster.
The DaemonSet ensures that a pod is running on each node in your cluster, which collects logs and forwards them to the specified Loki endpoint in your Cockpit.
-
-
(Optional) Run the following command to check the status of the release and ensure it was installed:
helm list
Send Kubernetes logs using Helm chart with Terraform/OpenTofu
You can also use Terraform/OpenTofu to manage and deploy Helm charts, providing you with more automation and consistency to manage your Kubernetes resources.
-
Create a
provider.tffile and paste the following template to set up the Helm Terraform/OpenTofu provider.Ensure that you replace:
your_k8s_cluster_hostwith the URL of your Kubernetes API serveryour_k8s_cluster_tokenwith the authentication token to access the clusteryour_k8s_cluster_ca_certificatewith the CA certificate of the cluster
provider "helm" { kubernetes = { host = "your_k8s_cluster_host" token = "your_k8s_cluster_token" cluster_ca_certificate = base64decode("your_k8s_cluster_ca_certificate") } } -
Create a
maint.tffile and paste the following template to create a Helm release resource.Make sure that you replace:
/your-path/to/values.ymlwith the actual path to your values filename-of-your-log-ingesterwith your chosen name of your log ingester (e.g.,alloy-logs-ingester)
resource "helm_release" "alloy" { name = "name-of-your-log-ingester" repository = "https://grafana.github.io/helm-charts" chart = "k8s-monitoring" version = "4.5.0" namespace = "log-ingester" create_namespace = true values = [file("/your-path/to/values.yml")] } -
Save your changes.
-
Run
terraform initto initialize your Terraform/OpenTofu configuration and download any necessary providers. -
Run
terraform applyto apply your configuration. -
Type
yeswhen prompted to confirm the actions.
Explore your logs in Cockpit
- In the Scaleway console side menu, go to Monitoring > Cockpit. The Overview page opens.
- Click Access Grafana to open your preconfigured dashboards in Grafana. You are redirected to the Grafana website.
- Log in to your Grafana account.
- Click Explore in the Grafana main menu.
- Select your custom data source in the search dropdown.
- In the Labels filter dropdown, select the
clusterlabel and in the Value dropdown, select your cluster. - (Optional) Click the Clock icon and filter by time range.
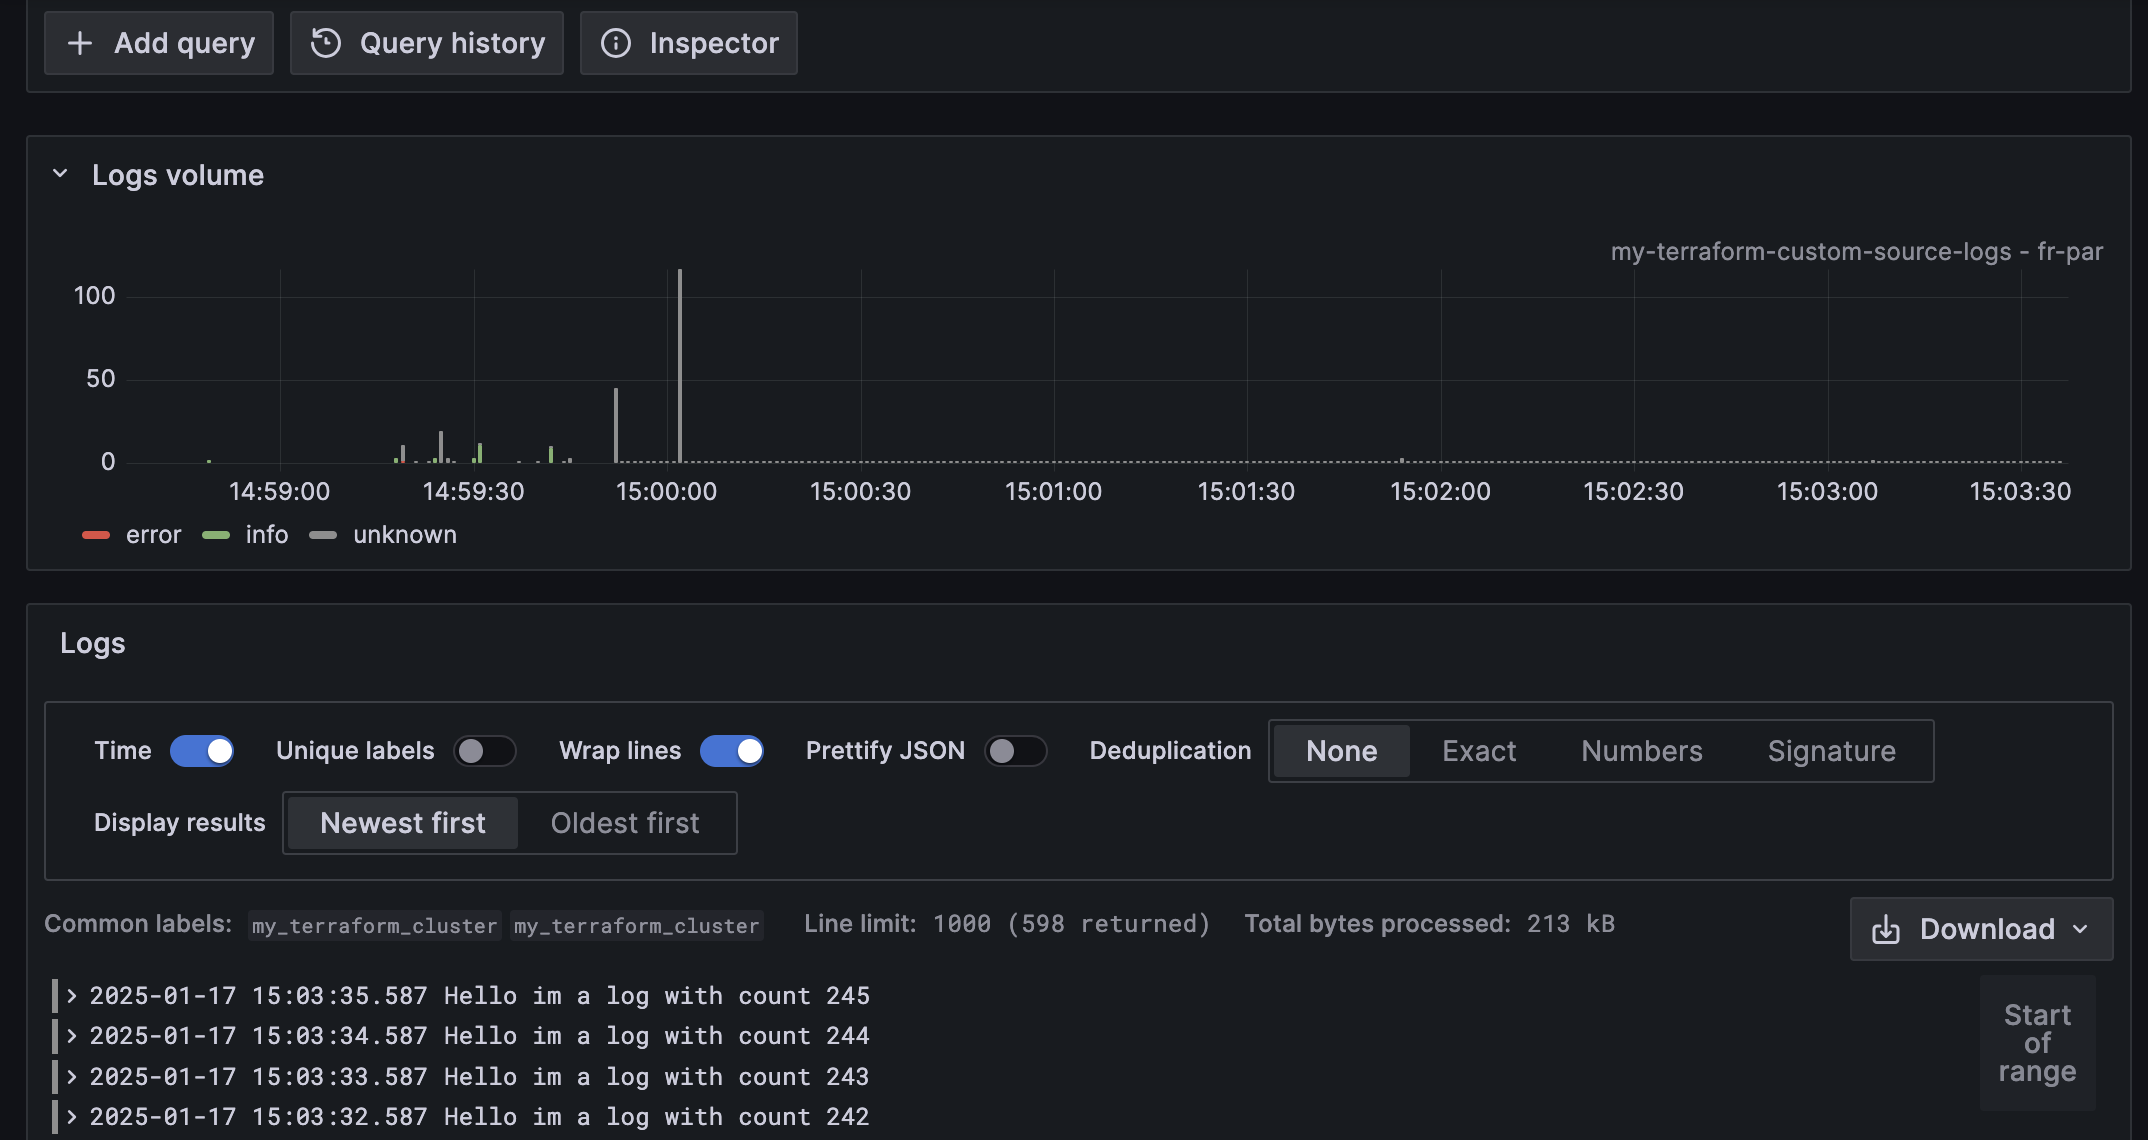
- Click Run query to see your logs. An output similar to the following should display.
Related resources
To learn how to set up log collection using the Scaleway CLI, see:
For detailed information about how to set up a complete monitoring stack (logs and metrics) using Terraform, see:
- Add Kubernetes Monitoring to an Existing Kapsule Cluster (Terraform)
- Complete Kubernetes Monitoring Setup on Scaleway (Terraform)