Understanding environmental footprint estimation
When you order a product that integrates the Environmental Footprint Calculator, you can see the estimated impact of the product before you order.
In this page, we use Elastic Metal servers as an example to explain how the estimation represented.
Availability Zone footprint estimation
When you select your Elastic Metal server's Availability Zone, you can see the quantity of CO2 equivalent (CO2e) emitted per kWh consumed for each zone.

This data is determined by the Power Usage Effectiveness (PUE) of the data center and the energy mix of the country in which the data center is located.
The estimation is represented by three green leaf icons:
- When the three leaves are dark green, this means that the AZ has the lowest quantity of CO2e emitted per kWh consumed, and each kw consumed in your Elastic Metal has a lower impact.
- When two leaves are dark green, this means that the AZ has a low quantity of CO2e emitted per kWh consumed
- When only one leaf is dark green, the AZ has a bigger quantity of CO2e emitted per kWh consumed
Elastic Metal offers footprint estimation
For Elastic Metal offers, the environmental footprint estimation considers the impact of the manufacturing and use of all the elements that allow the service to work, such as network, cross-IT equipment and stock, and non-IT elements in addition to the manufacturing and use of the server itself. The AZ you chose in the previous step will impact the use by multiplying each kw consumed by each of these elements by the value indicated.
For usage, we rely on an estimate of electricity consumption. This estimation is based on tests carried out by the Hardware team at Scaleway. Each range of offers was tested using different compute configurations, to ensure coverage of a variety of possible power consumption set ups.
These different computing configurations allow us to simulate enough use cases to have an idea of the power consumption, but the actual consumption will depend on how the server is used in practice.
We estimate the measure the server's electricity consumption and then calculate its estimated impact based on the energy mix of the selected zone and the data center's PUE.
The estimation is represented by three green leaf icons:
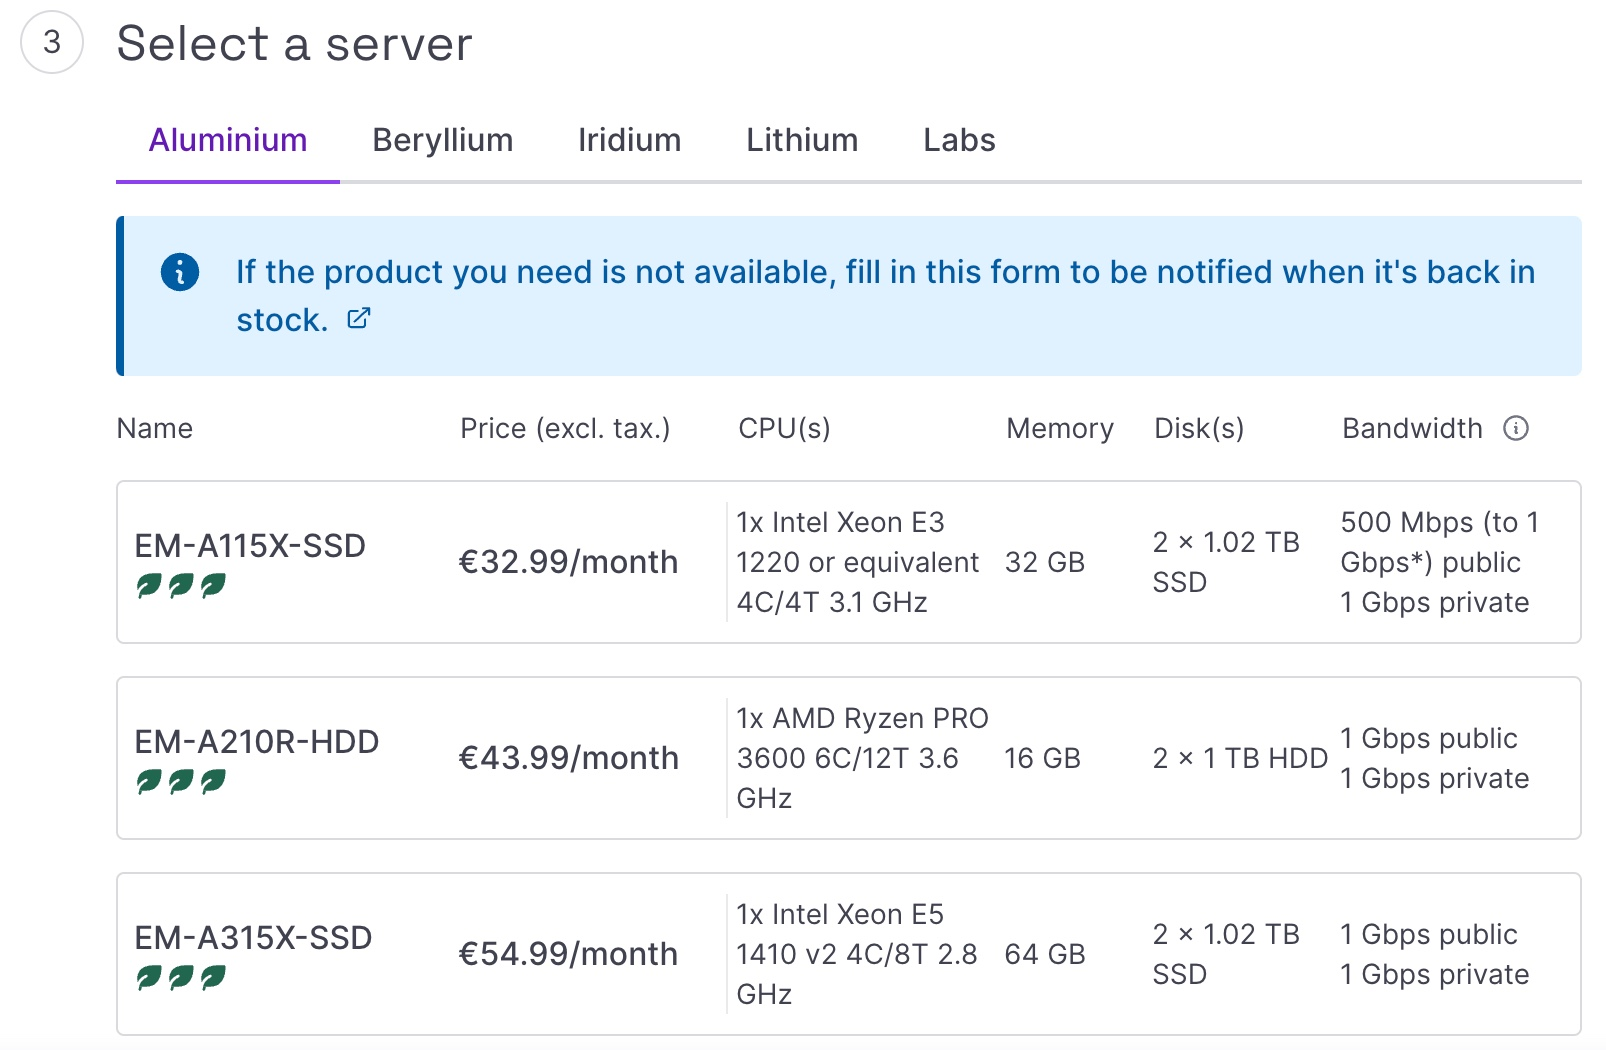
- When the three leaves are dark green, this means that the offer has the lowest environmental impact
- When two leaves are dark green, this means that the offer has a low environmental impact
- When only one leaf is dark green, the offer has a bigger environmental impact
A summary of the total environmental footprint estimation for the selected offer is shown before the order summary. We also add an indication to help you imagine what this impact is, such as ≈ 35 km by car.
