How to configure custom alerts in Grafana
Cockpit does not support the Grafana alert manager nor Grafana-managed alert rules. You should only use the Grafana interface to define alert rules, not to evaluate or receive alert notifications. Alerting rules are evaluated at the data source level and notifications are handled and sent out by the Scaleway alert manager only.
Once the conditions of your alert rule are met, the rule evaluation engine of your data source forwards the firing alert to the Scaleway alert manager, which then sends a notification to the contacts you have configured in the Scaleway console or in Grafana.
You can also create alerting rules on both Scaleway data sources or your custom data sources.
This page shows you how to create alert rules in Grafana for monitoring Scaleway resources integrated with Cockpit, such as Object Storage or Kubernetes. These alerts rely on Scaleway-provided metrics, which are available in the Metrics browser drop-down when using the Scaleway Metrics data source in the Grafana interface. This page explains how to use the Scaleway Metrics data source, interpret metrics, set alert conditions, and activate alerts.
Before you start
To complete the actions presented below, you must have:
- A Scaleway account logged into the console
- Owner status or IAM permissions allowing you to perform actions in the intended Organization
- Scaleway resources you can monitor
- Enabled the Scaleway alert manager in the same region as the resources you want to be alerted for
- Added contacts in the Scaleway console or contact points in Grafana (with the
Scaleway Alertingalert manager of the same region as yourScaleway Metricsdata source), otherwise alerts will not be delivered - Read the dedicated documentation about limits to ensure your alert condition contains valid parameters
Interactive demo
Find out how to configure custom alerts in Grafana using our interactive demo.
Switch to the data source-managed tab
Data source managed alert rules allow you to configure alerts managed by the data source of your choice, instead of using Grafana's managed alerting system which is not supported by Cockpit.
-
Log in to Grafana using your Scaleway credentials.
-
Click the Grafana icon in the top left side of your screen to open the menu.
-
Click the arrow next to Alerting on the left-side menu, then click Alert rules.
-
Click + New alert rule.
-
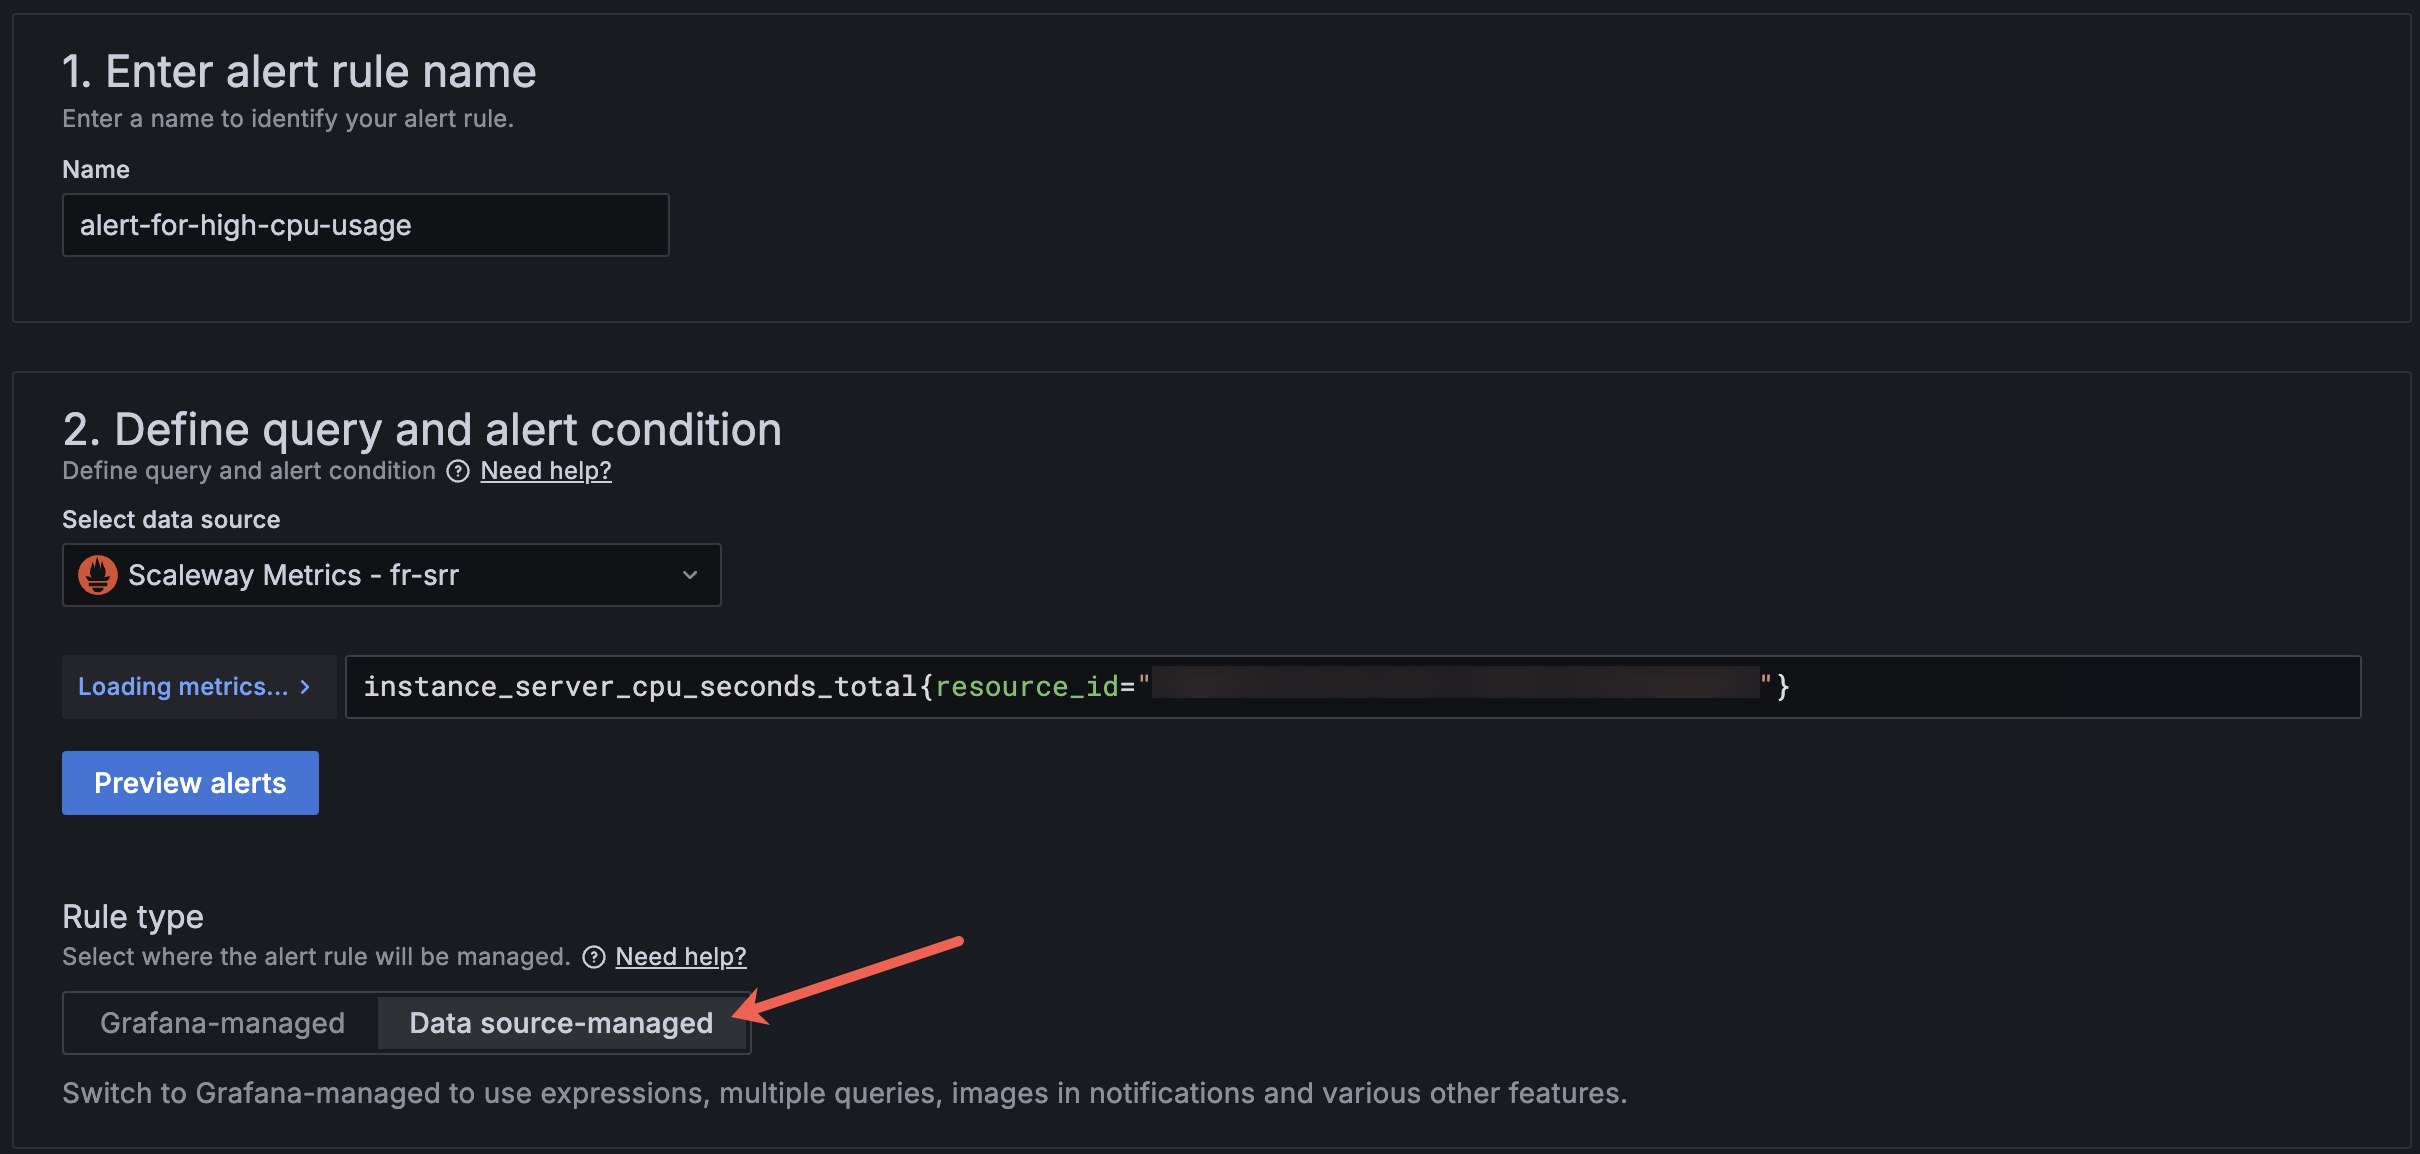
Enter a name for your alert.
-
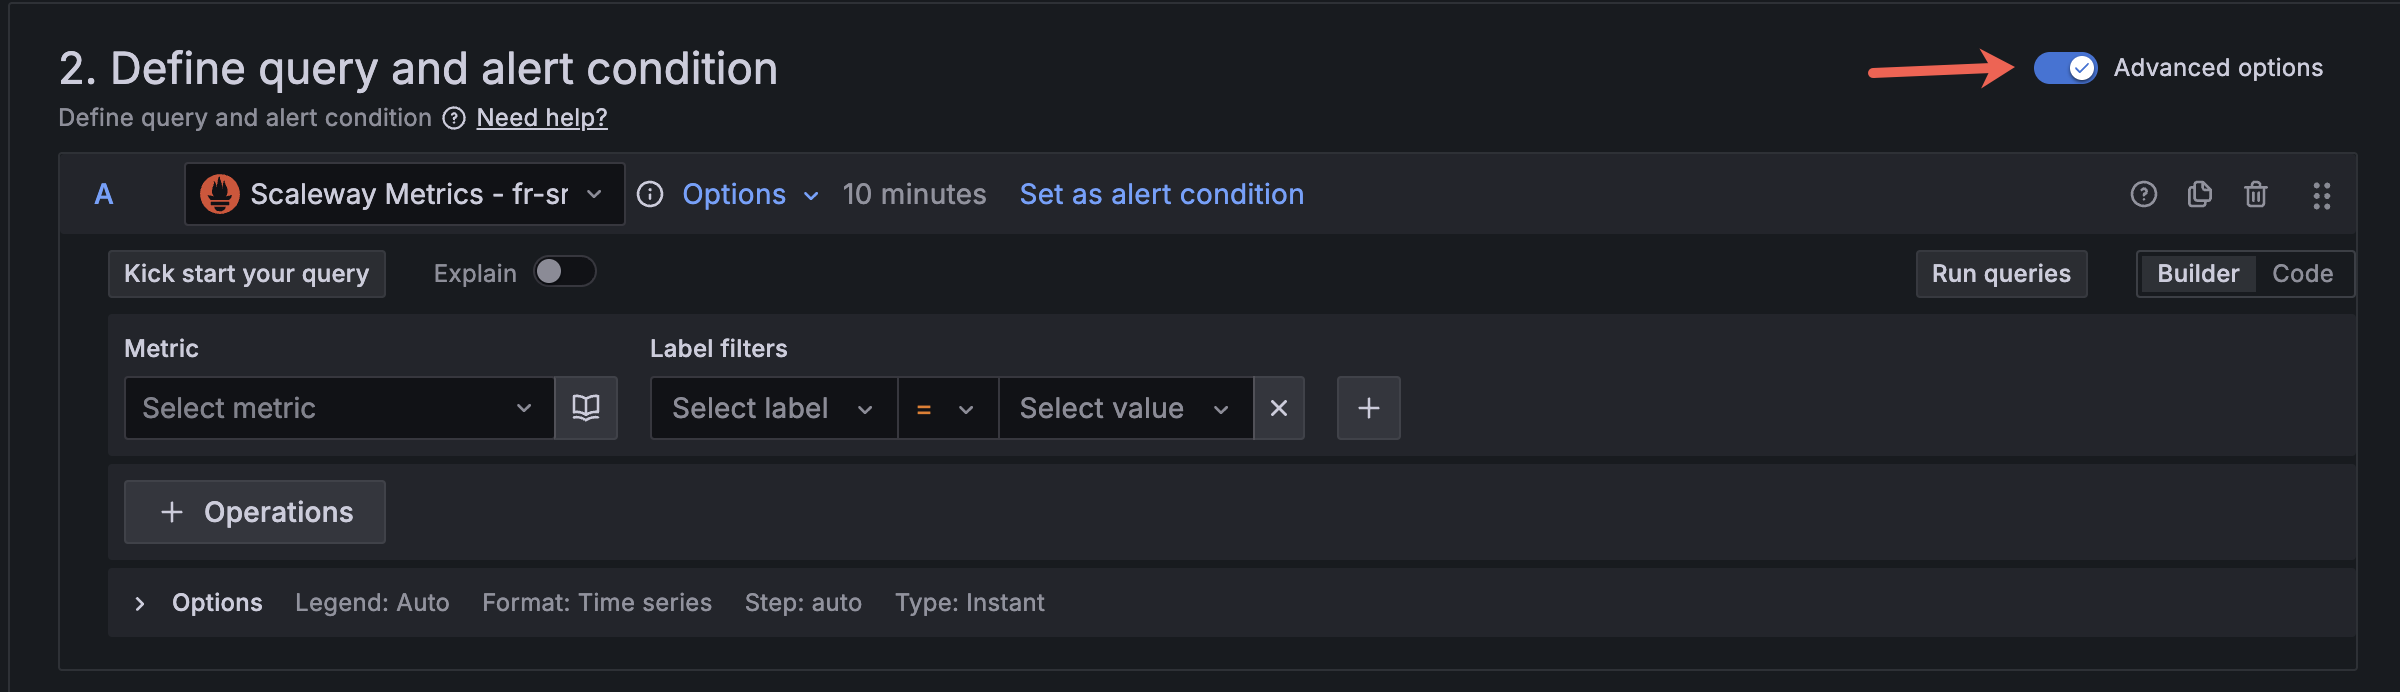
In the Define query and alert condition section, toggle Advanced options.
-
Select the Scaleway Metrics data source in the drop-down.
-
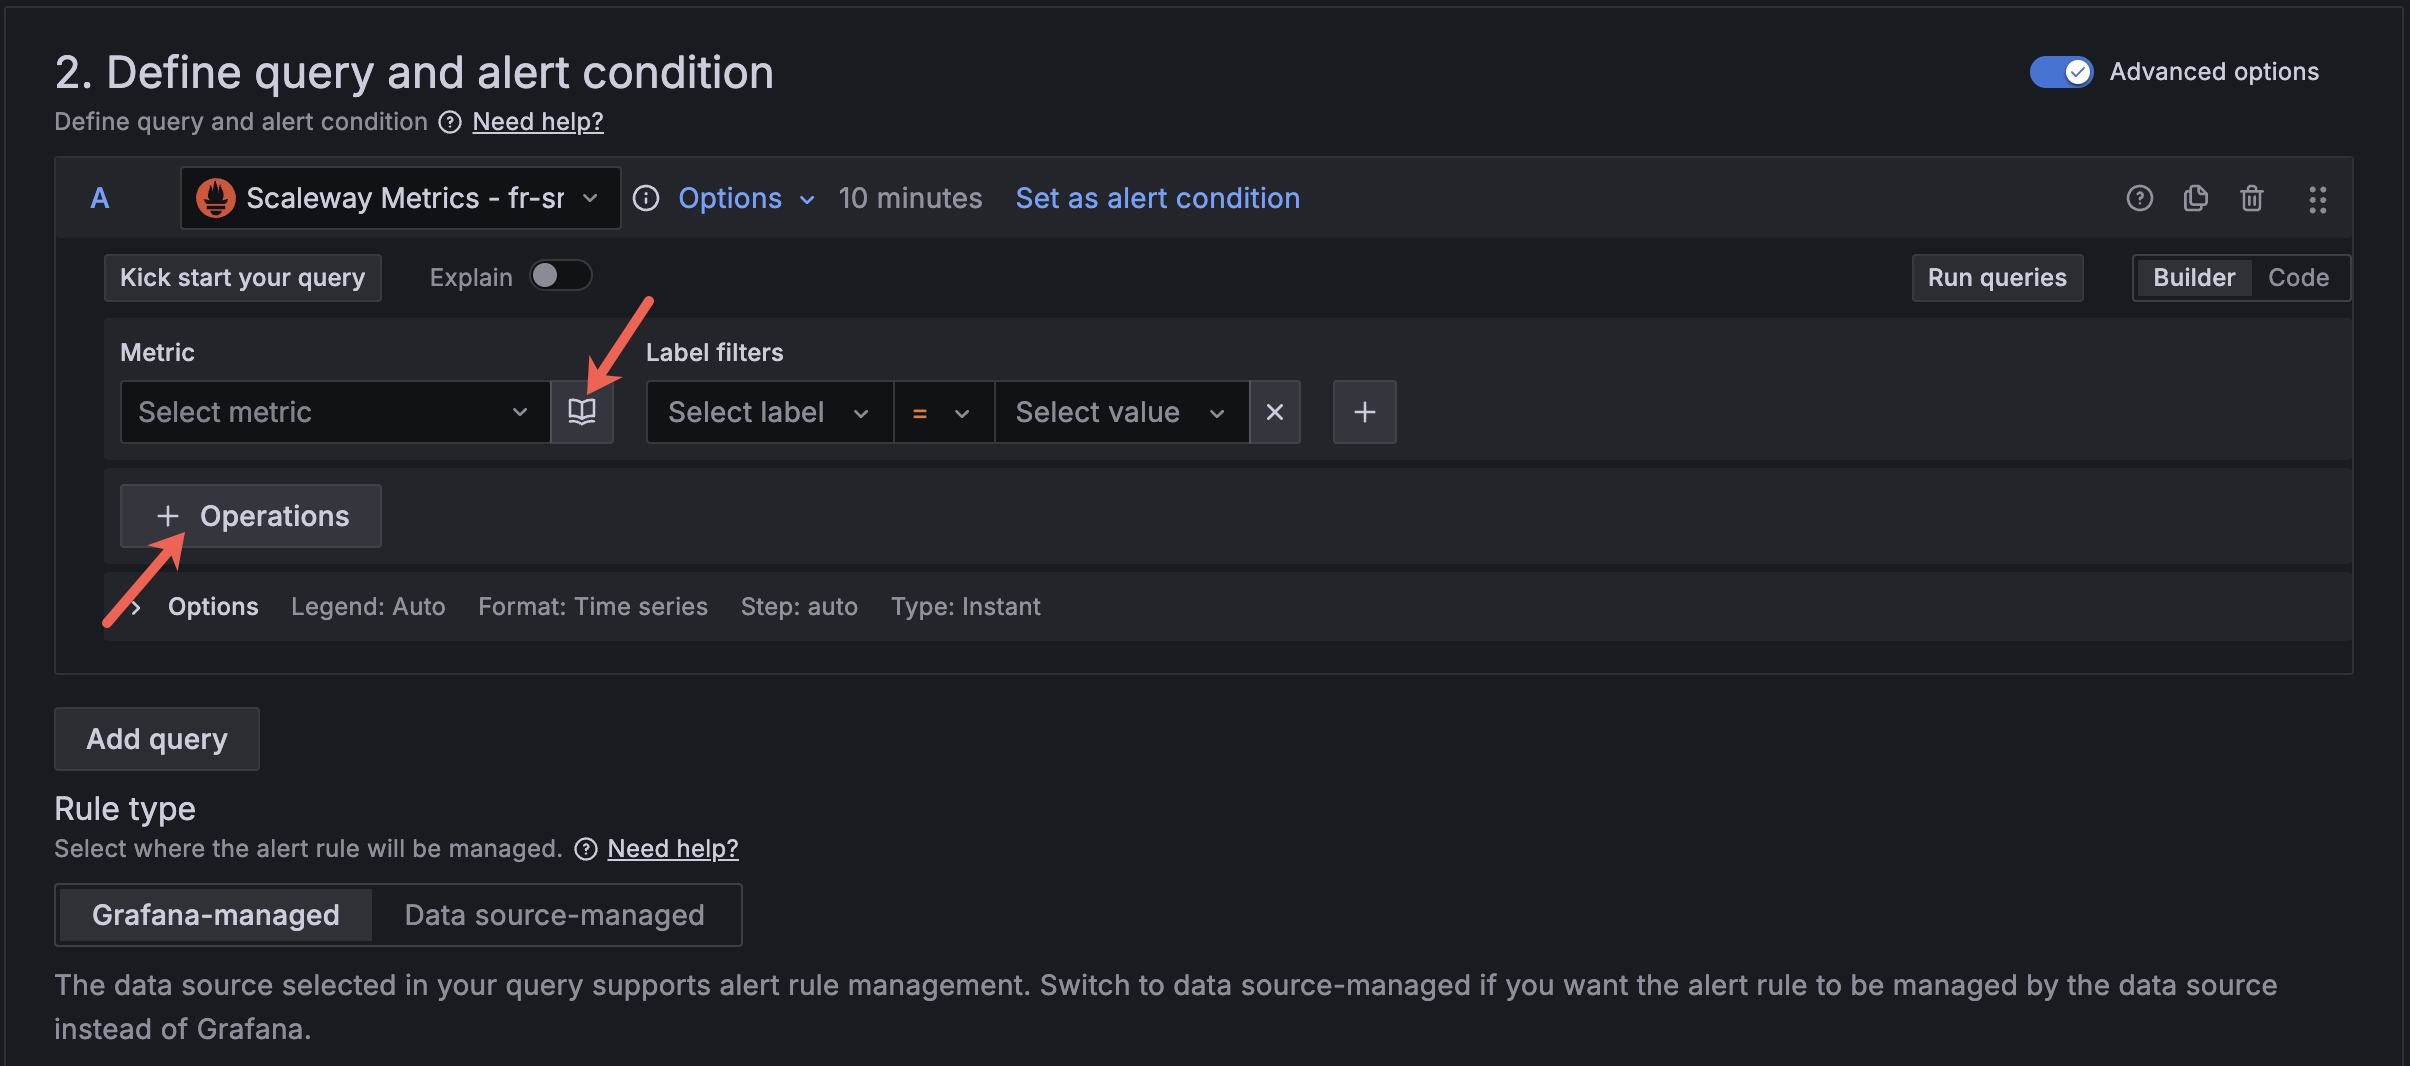
In the Rule type subsection, click the Data source-managed tab.
Define your metric and alert conditions
Switch between the tabs below to create alerts for an Object Storage bucket, a Kubernetes cluster Pod, or Cockpit logs ingestion.
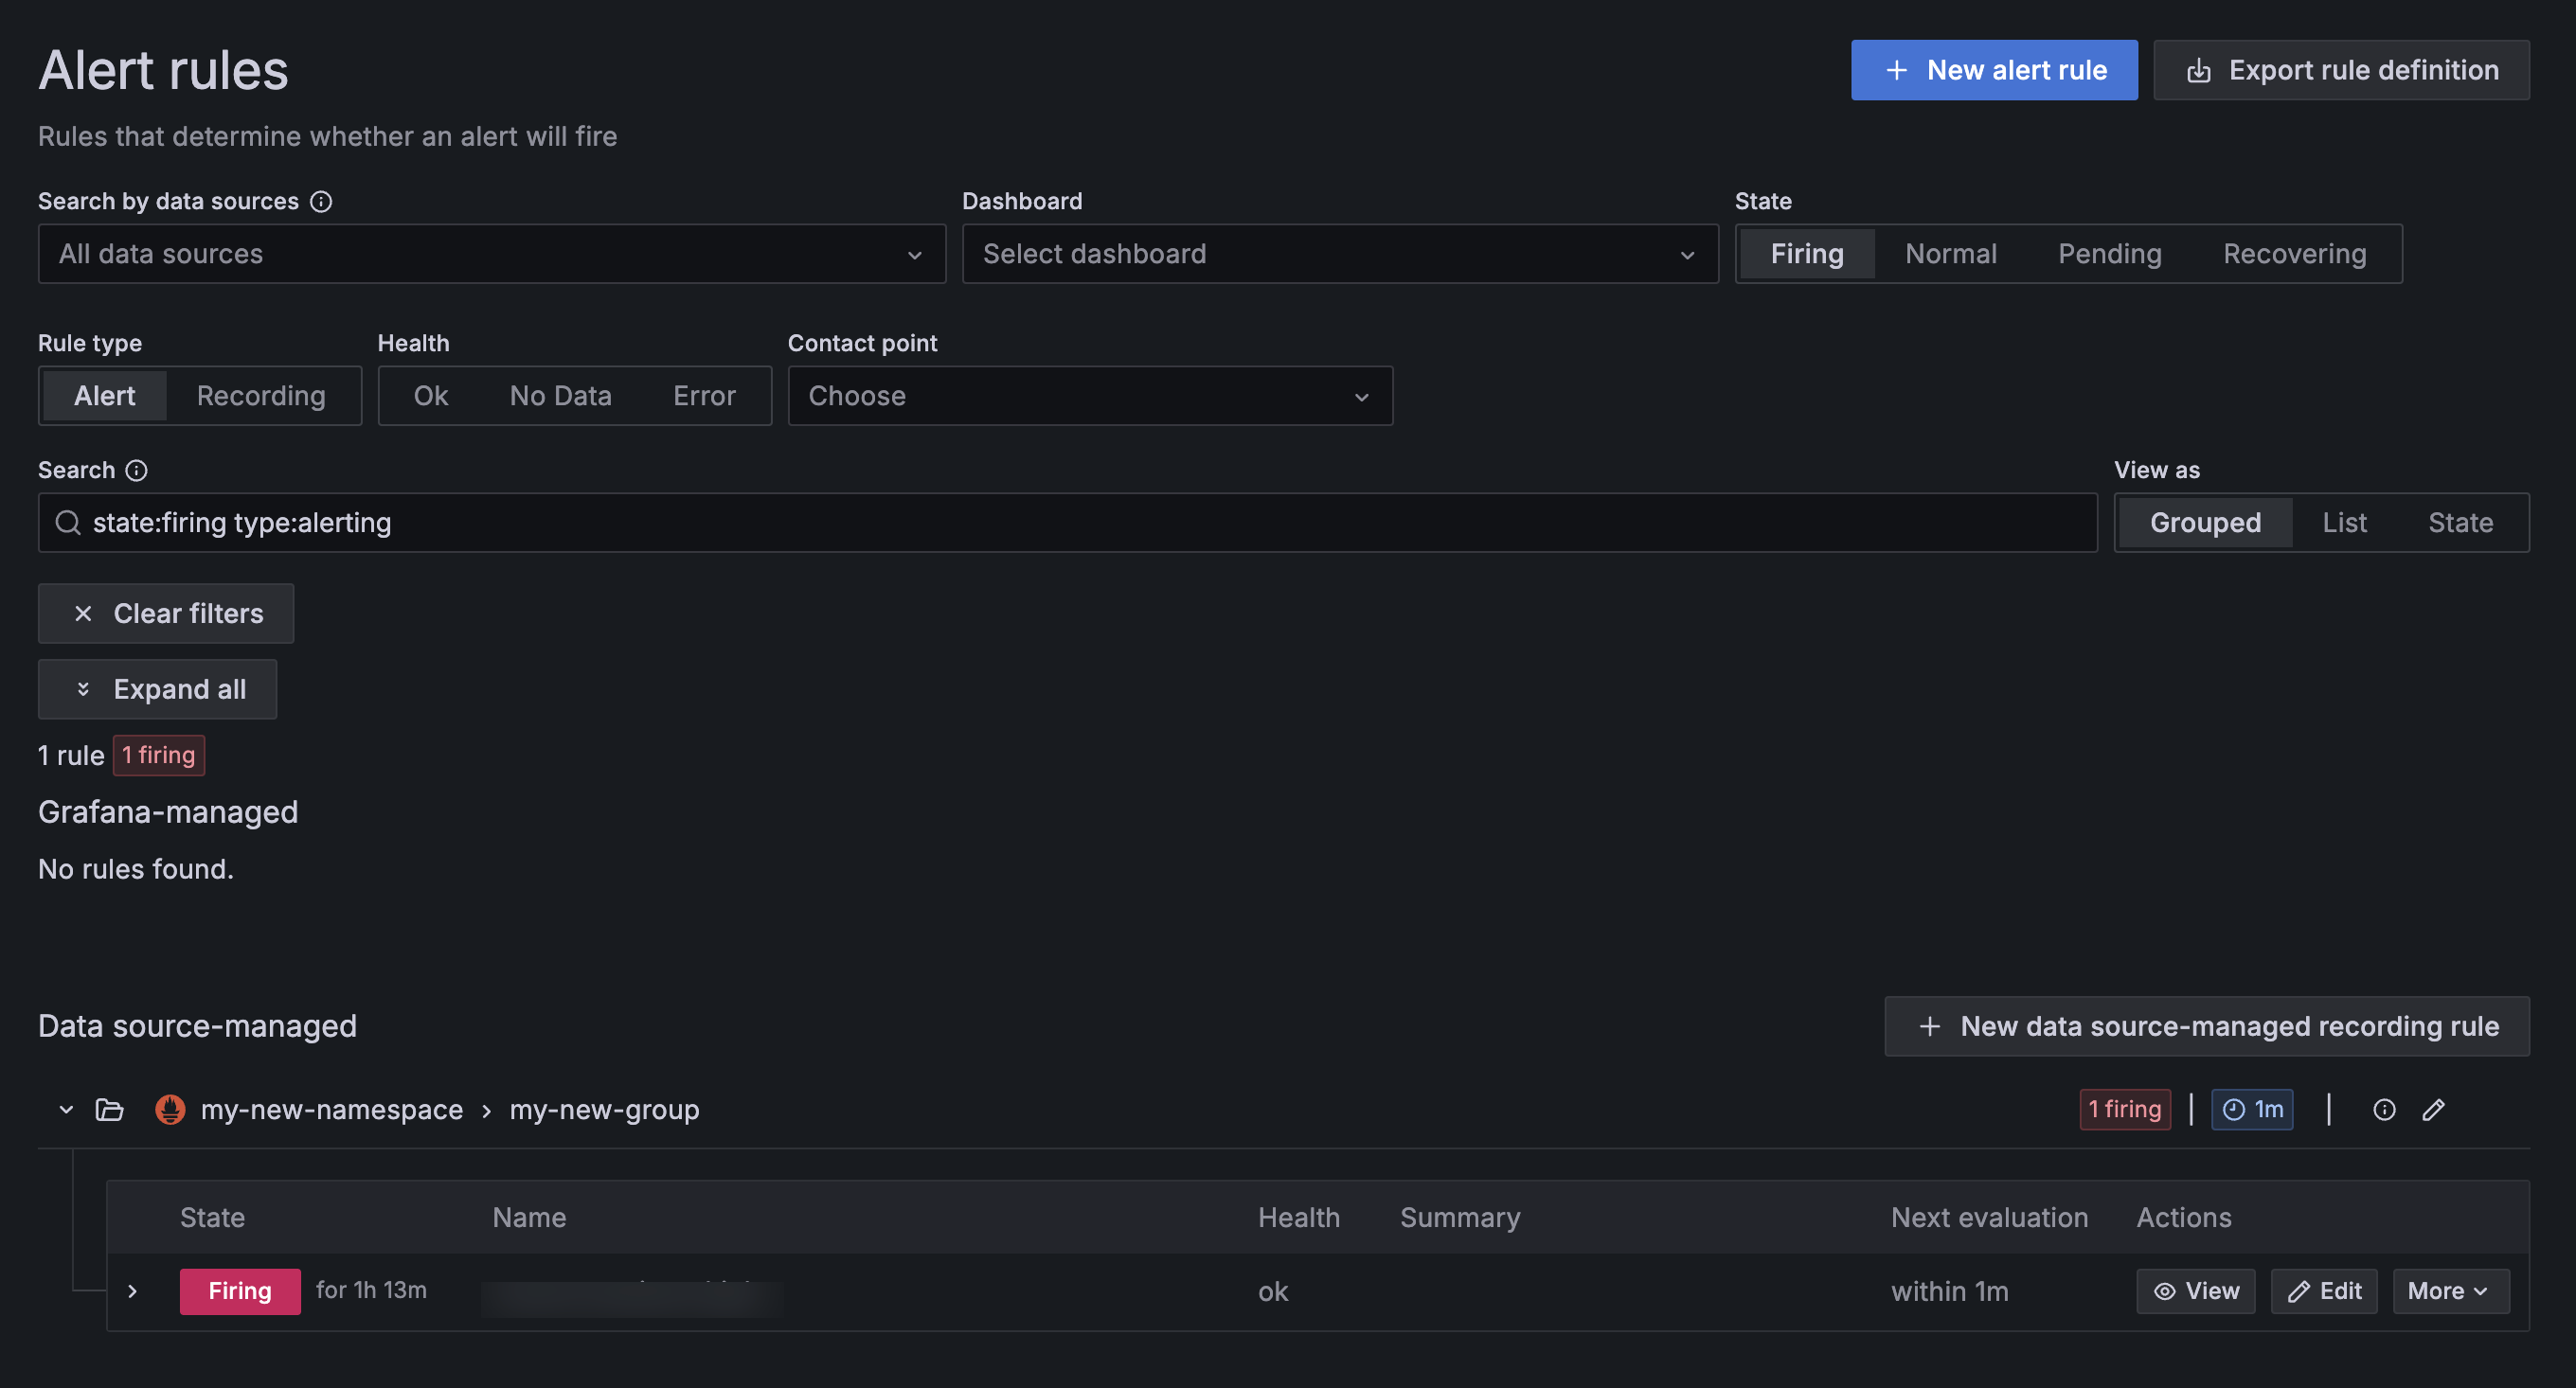
View firing alerts
- Log in to Grafana using your Scaleway credentials.
- Click the Grafana icon in the top left side of your screen to open the menu.
- Click the arrow next to Alerting on the left-side menu, then click Alert rules.
- Click the Firing tab under the State section to filter for firing rules.
- Click the Alert tab under the Rule type section to filter for alerting rules.
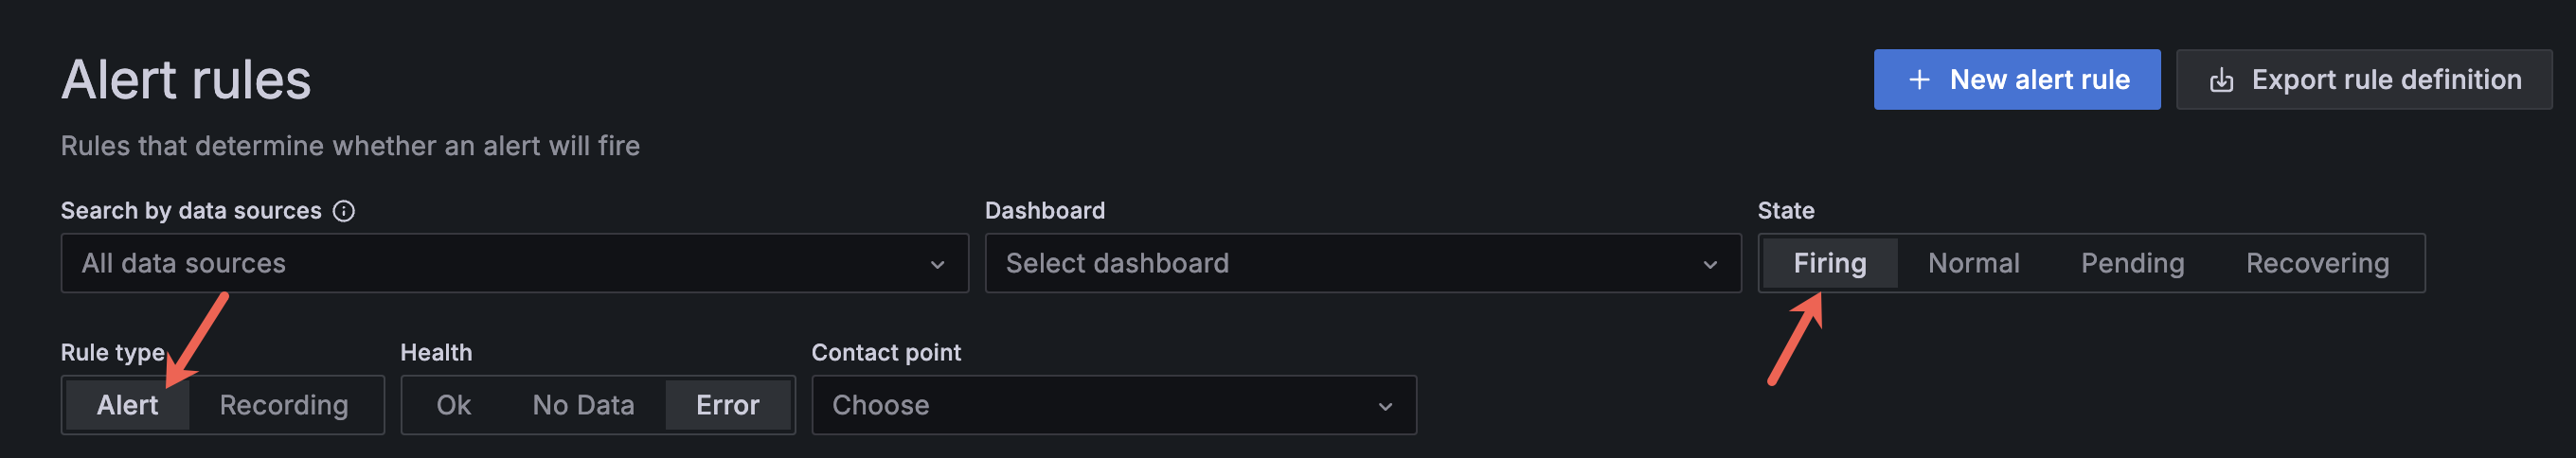
Your firing alerts should display.