Kubernetes Kapsule cluster monitoring with Prometheus & Grafana
Kubernetes Kapsule provides a managed Kubernetes environment to create, configure, and run a cluster of preconfigured machines for containerized applications.
This tutorial will explain how to monitor your Kubernetes Kapsule cluster. The stack that we are going to deploy is based on Prometheus, Grafana, kube-state-metrics, and node-exporter. We will use Helm to deploy the whole stack. All applications used for this how-to are well-known and widely-used open-source software that fit well in a Kubernetes environment.
- Prometheus:
Prometheusis an application used for monitoring and alerting. It records real-time metrics in a time series database. It is based on a pull model and relies on HTTP for scraping the metrics. - Grafana:
Grafanais used for visualizing the metrics scraped by Prometheus and stored in the time series database. - kube-state-metrics:
kube-state-metricslistens to the Kubernetes API server and generates metrics about the state of the objects. The list of the exported metrics is available here. For instance,kube-state-metricscan report the number of Pods ready (kube_pod_status_ready), or the number of unschedulable Pods (kube_pod_status_unschedulable). - node-exporter: The
node-exporteris a Prometheus exporter for hardware and OS metrics exposed by the Linux Kernel. It allows you to get metrics about CPU, memory, file system for each Kubernetes node.
Before you start
To complete the actions presented below, you must have:
- A Scaleway account logged into the console
- Owner status or IAM permissions allowing you to perform actions in the intended Organization
- Created a Kapsule cluster
- A working kubectl on your machine
- Installed
helm(version 3.2+), the Kubernetes package manager, on your local machine
Preparing the Kubernetes Kapsule cluster
- Ensure you are connected to your cluster and
kubectlandhelmare installed on your local machine. - Add the Prometheus Community Helm repo and the stable Kubernetes repo and update them:
helm repo add prometheus-community https://prometheus-community.github.io/helm-charts
helm repo add stable https://kubernetes-charts.storage.googleapis.com/
helm repo update
Deploying Prometheus
We are first going to deploy the Prometheus stack in a dedicated Kubernetes namespace called "monitoring". We will set the retention time for 30 days and create a persistent volume (based on Scaleway Block Storage) to store the Prometheus data.
-
Use the
helmpackage manager to install the stable release of Prometheus. Set the following parameters tohelmfor both of these:server.persistentVolume: 100Giserver.retention: 30d
helm install prometheus prometheus-community/prometheus --create-namespace --namespace monitoring --set server.persistentVolume.size=100Gi,server.retention=30d NAME: prometheus LAST DEPLOYED: Thu Jan 9 14:30:50 2025 NAMESPACE: monitoring STATUS: DEPLOYED [..] -
Once the stack is deployed, verify that the created Pods are all running. It is also possible to check if the 100 Gi block volume was created:
kubectl get pods,pv,pvc -n monitoring NAME READY STATUS RESTARTS AGE pod/prometheus-alertmanager-6565668c85-5vdxc 2/2 Running 0 67s pod/prometheus-kube-state-metrics-6756bbbb8-6qs9r 1/1 Running 0 67s pod/prometheus-node-exporter-fbg6s 1/1 Running 0 67s pod/prometheus-pushgateway-6d75c59b7b-6knfd 1/1 Running 0 67s pod/prometheus-server-556dbfdfb5-rx6nl 1/2 Running 0 67s -
To access
Prometheususe the Kubernetes port forwarding feature:export POD_NAME=$(kubectl get pods --namespace monitoring -l "app=prometheus,component=server" -o jsonpath="{.items[0].metadata.name}") kubectl --namespace monitoring port-forward $POD_NAME 9090 -
Access the
Prometheusdashboard using the following URL: http://localhost:9090.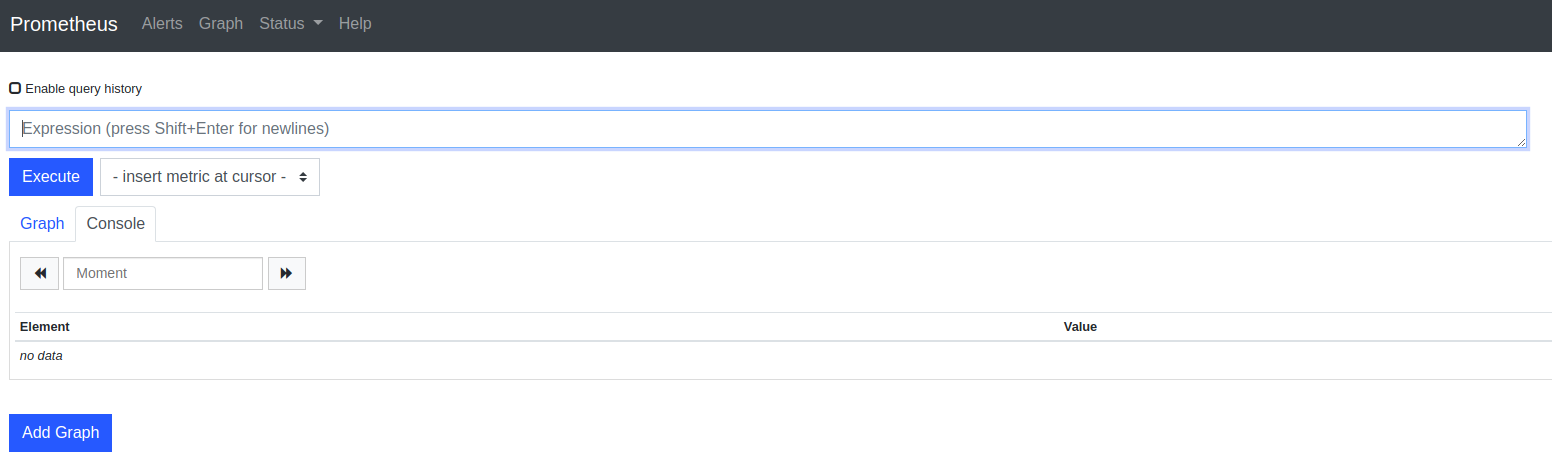
-
Verify that both
node-exporterandkube-state-metricsmetrics are correctly scrapped byPrometheus:-
The
node-exportermetrics begin with "node_"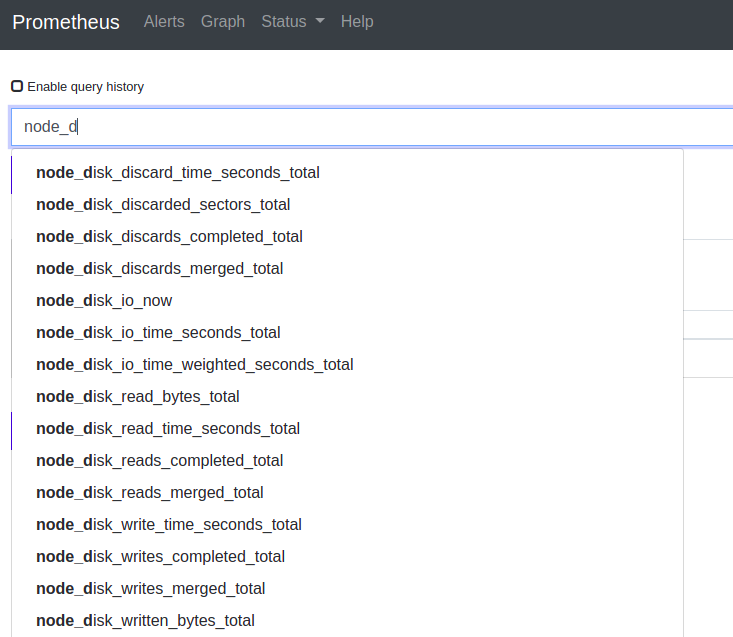
-
The
kube-state-metricsbegin with "kube_"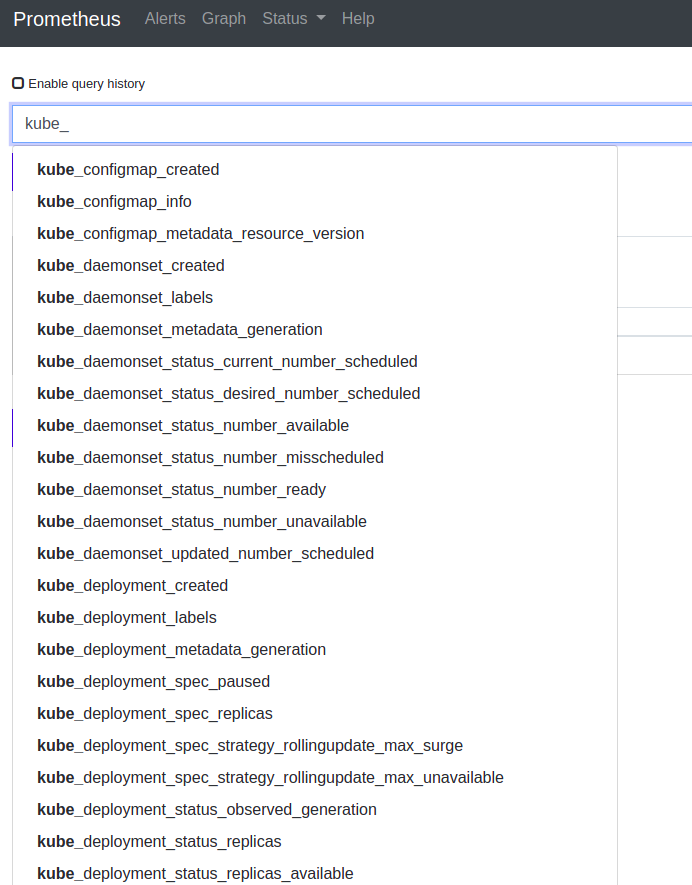
-
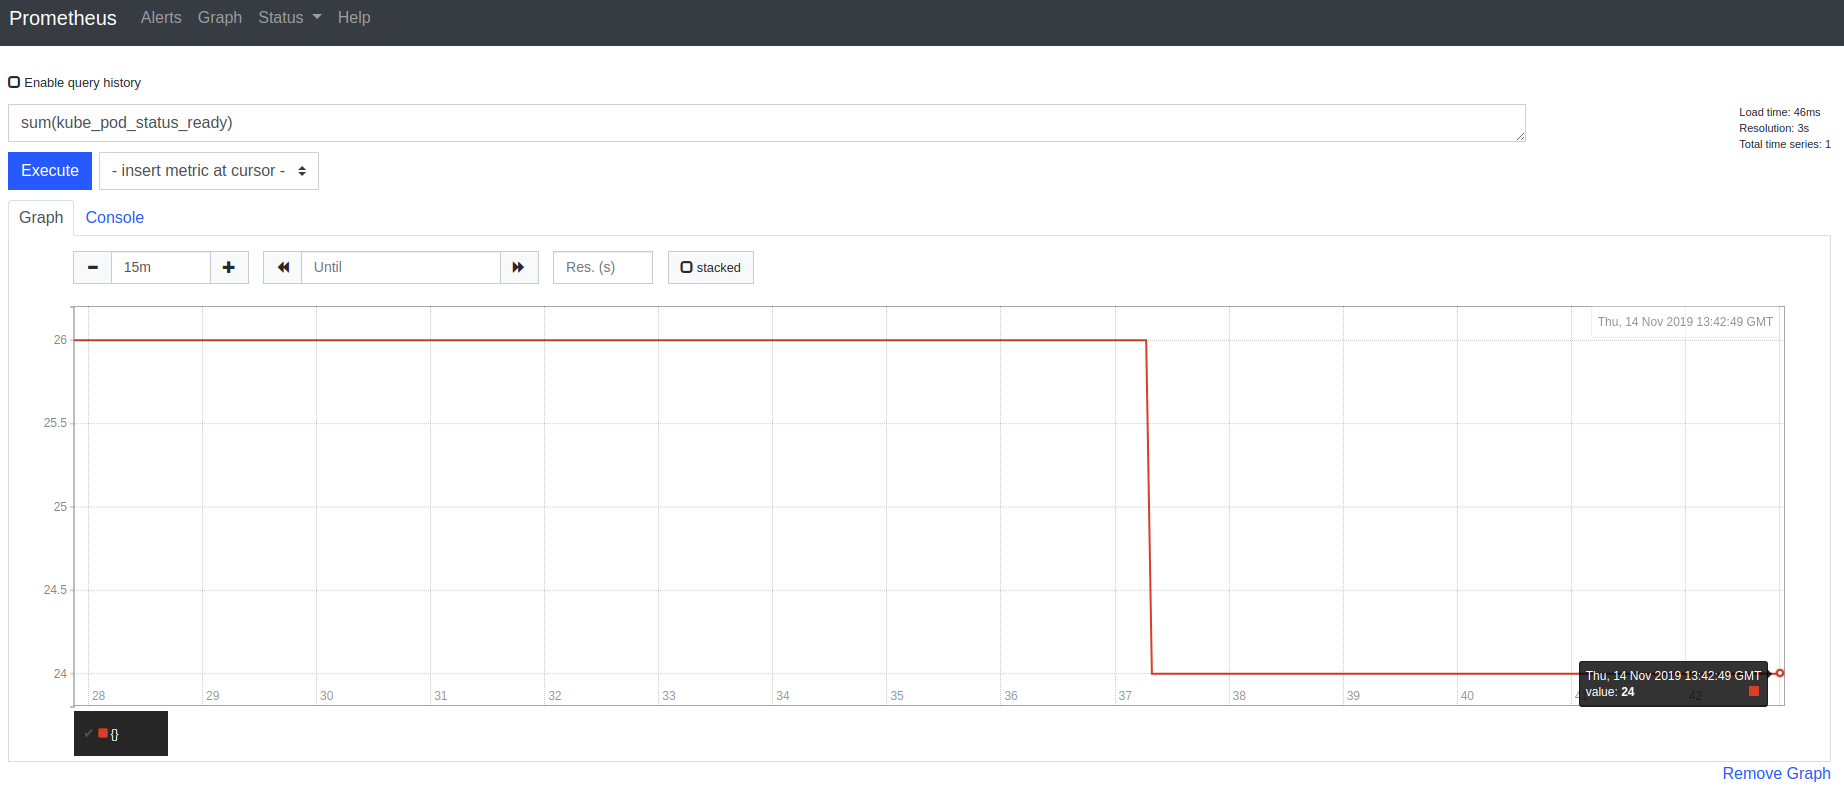
-
Prometheus can generate graphs on its own. You can test the feature by choosing metrics to analyze directly in the application:
Deploying Grafana
We are going to use and deploy Grafana to display the Prometheus metrics in some pre-defined dashboards. To do so, we are -as always- using helm. Once again we deploy it in the monitoring namespace and enable the persistence:
persistence.enable: truepersistence.type: pvcpersistence.size: 10Gi
Refer to the Loki tutorial to have additional information about Grafana.
- Add the Helm repo and install Grafana using
helmwith the following commands:helm repo add grafana https://grafana.github.io/helm-charts helm install grafana grafana/grafana \ --set persistence.enabled=true,persistence.type=pvc,persistence.size=10Gi \ --namespace=monitoring - Once
Grafanais installed retrieve the admin password:kubectl get secret --namespace monitoring grafana -o jsonpath="{.data.admin-password}" | base64 --decode ; echo - Configure the port forwarding to access the Grafana Web interface at this address: http://localhost:3000:
kubectl port-forward --namespace monitoring service/grafana 3000:80 Forwarding from 127.0.0.1:3000 -> 3000 Forwarding from [::1]:3000 -> 3000 - Open the Grafana Web Interface in a web browser at
http://localhost:3000. The login screen displays. Enter the useradminand the password recovered in step 2: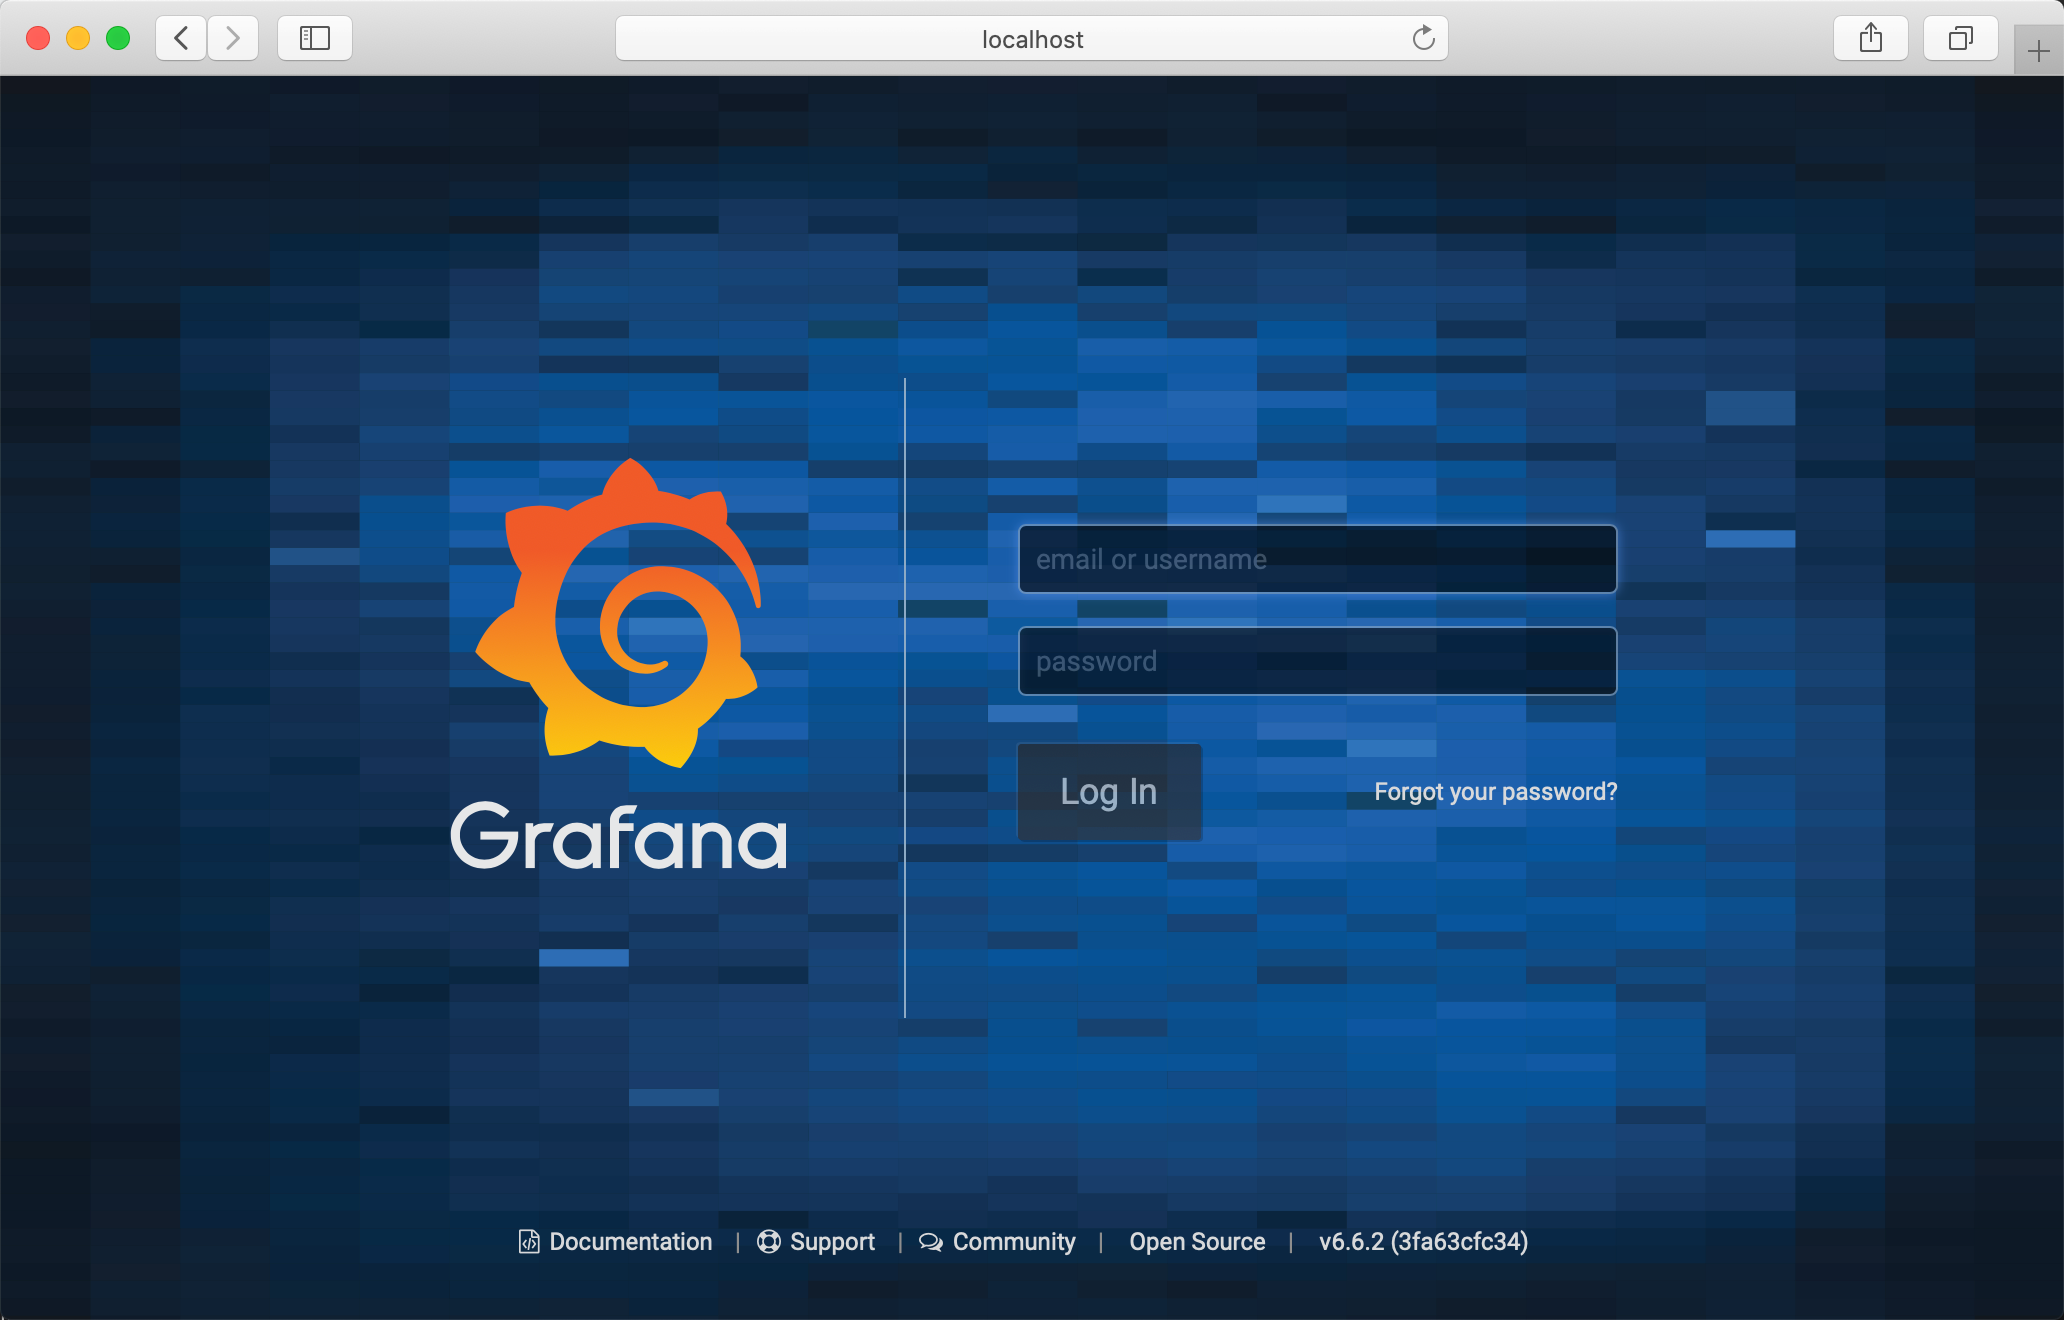
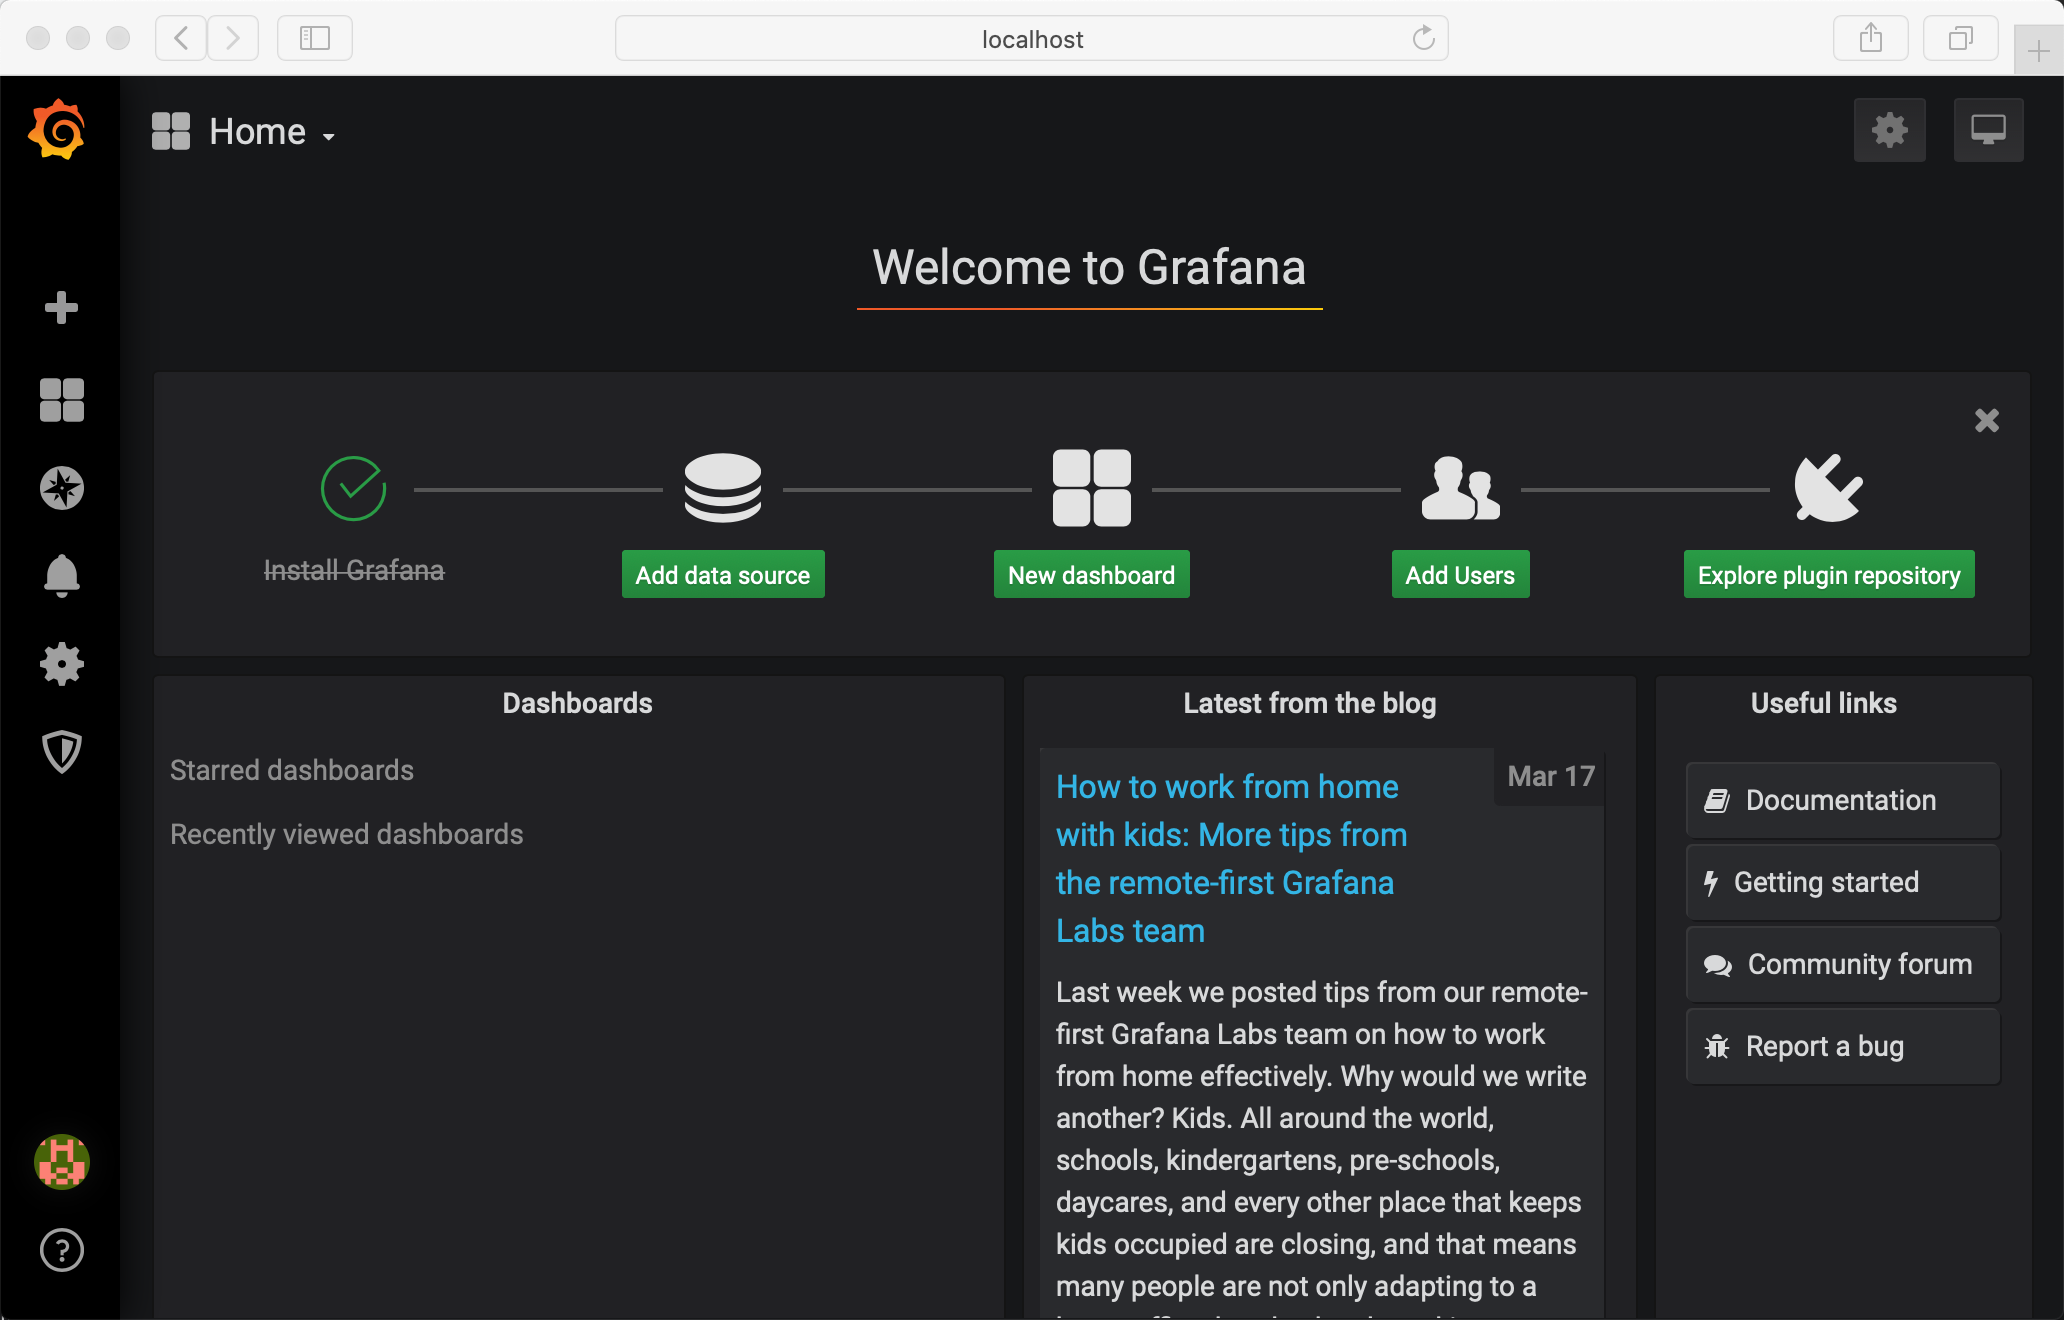
- The welcome screen displays and invites you to complete the configuration of Grafana. Click Add data source to configure a new data source:
- Choose Prometheus as data source from the list of available options.
- Enter the details of the data source. You can leave the default settings and add the data source:
http://prometheus-server. Click Test & Save to validate the connection to Prometheus and to save the settings: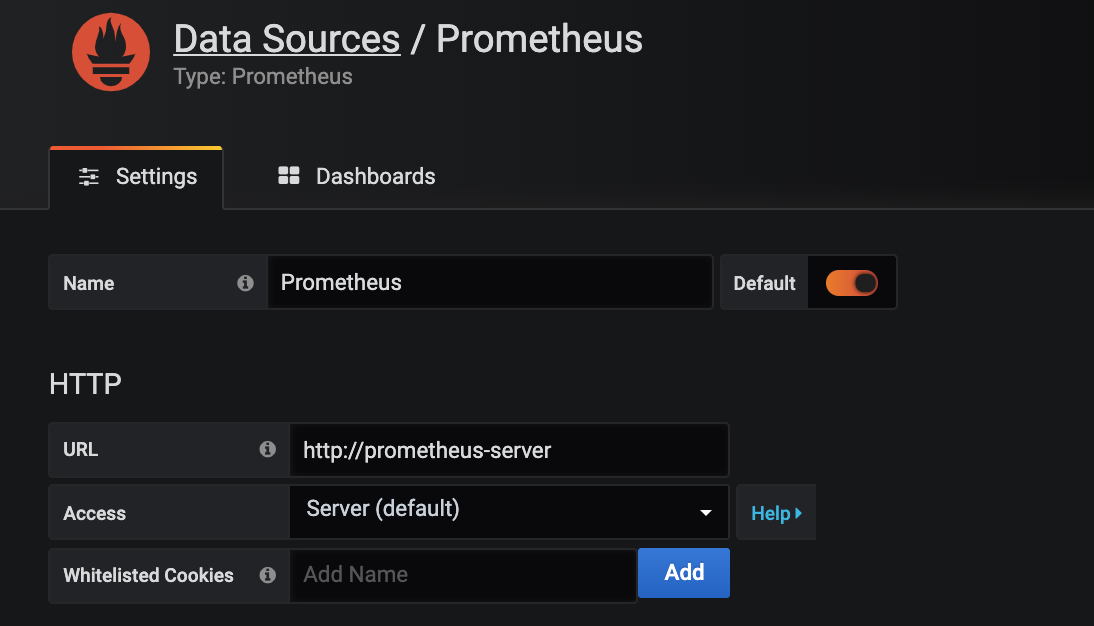
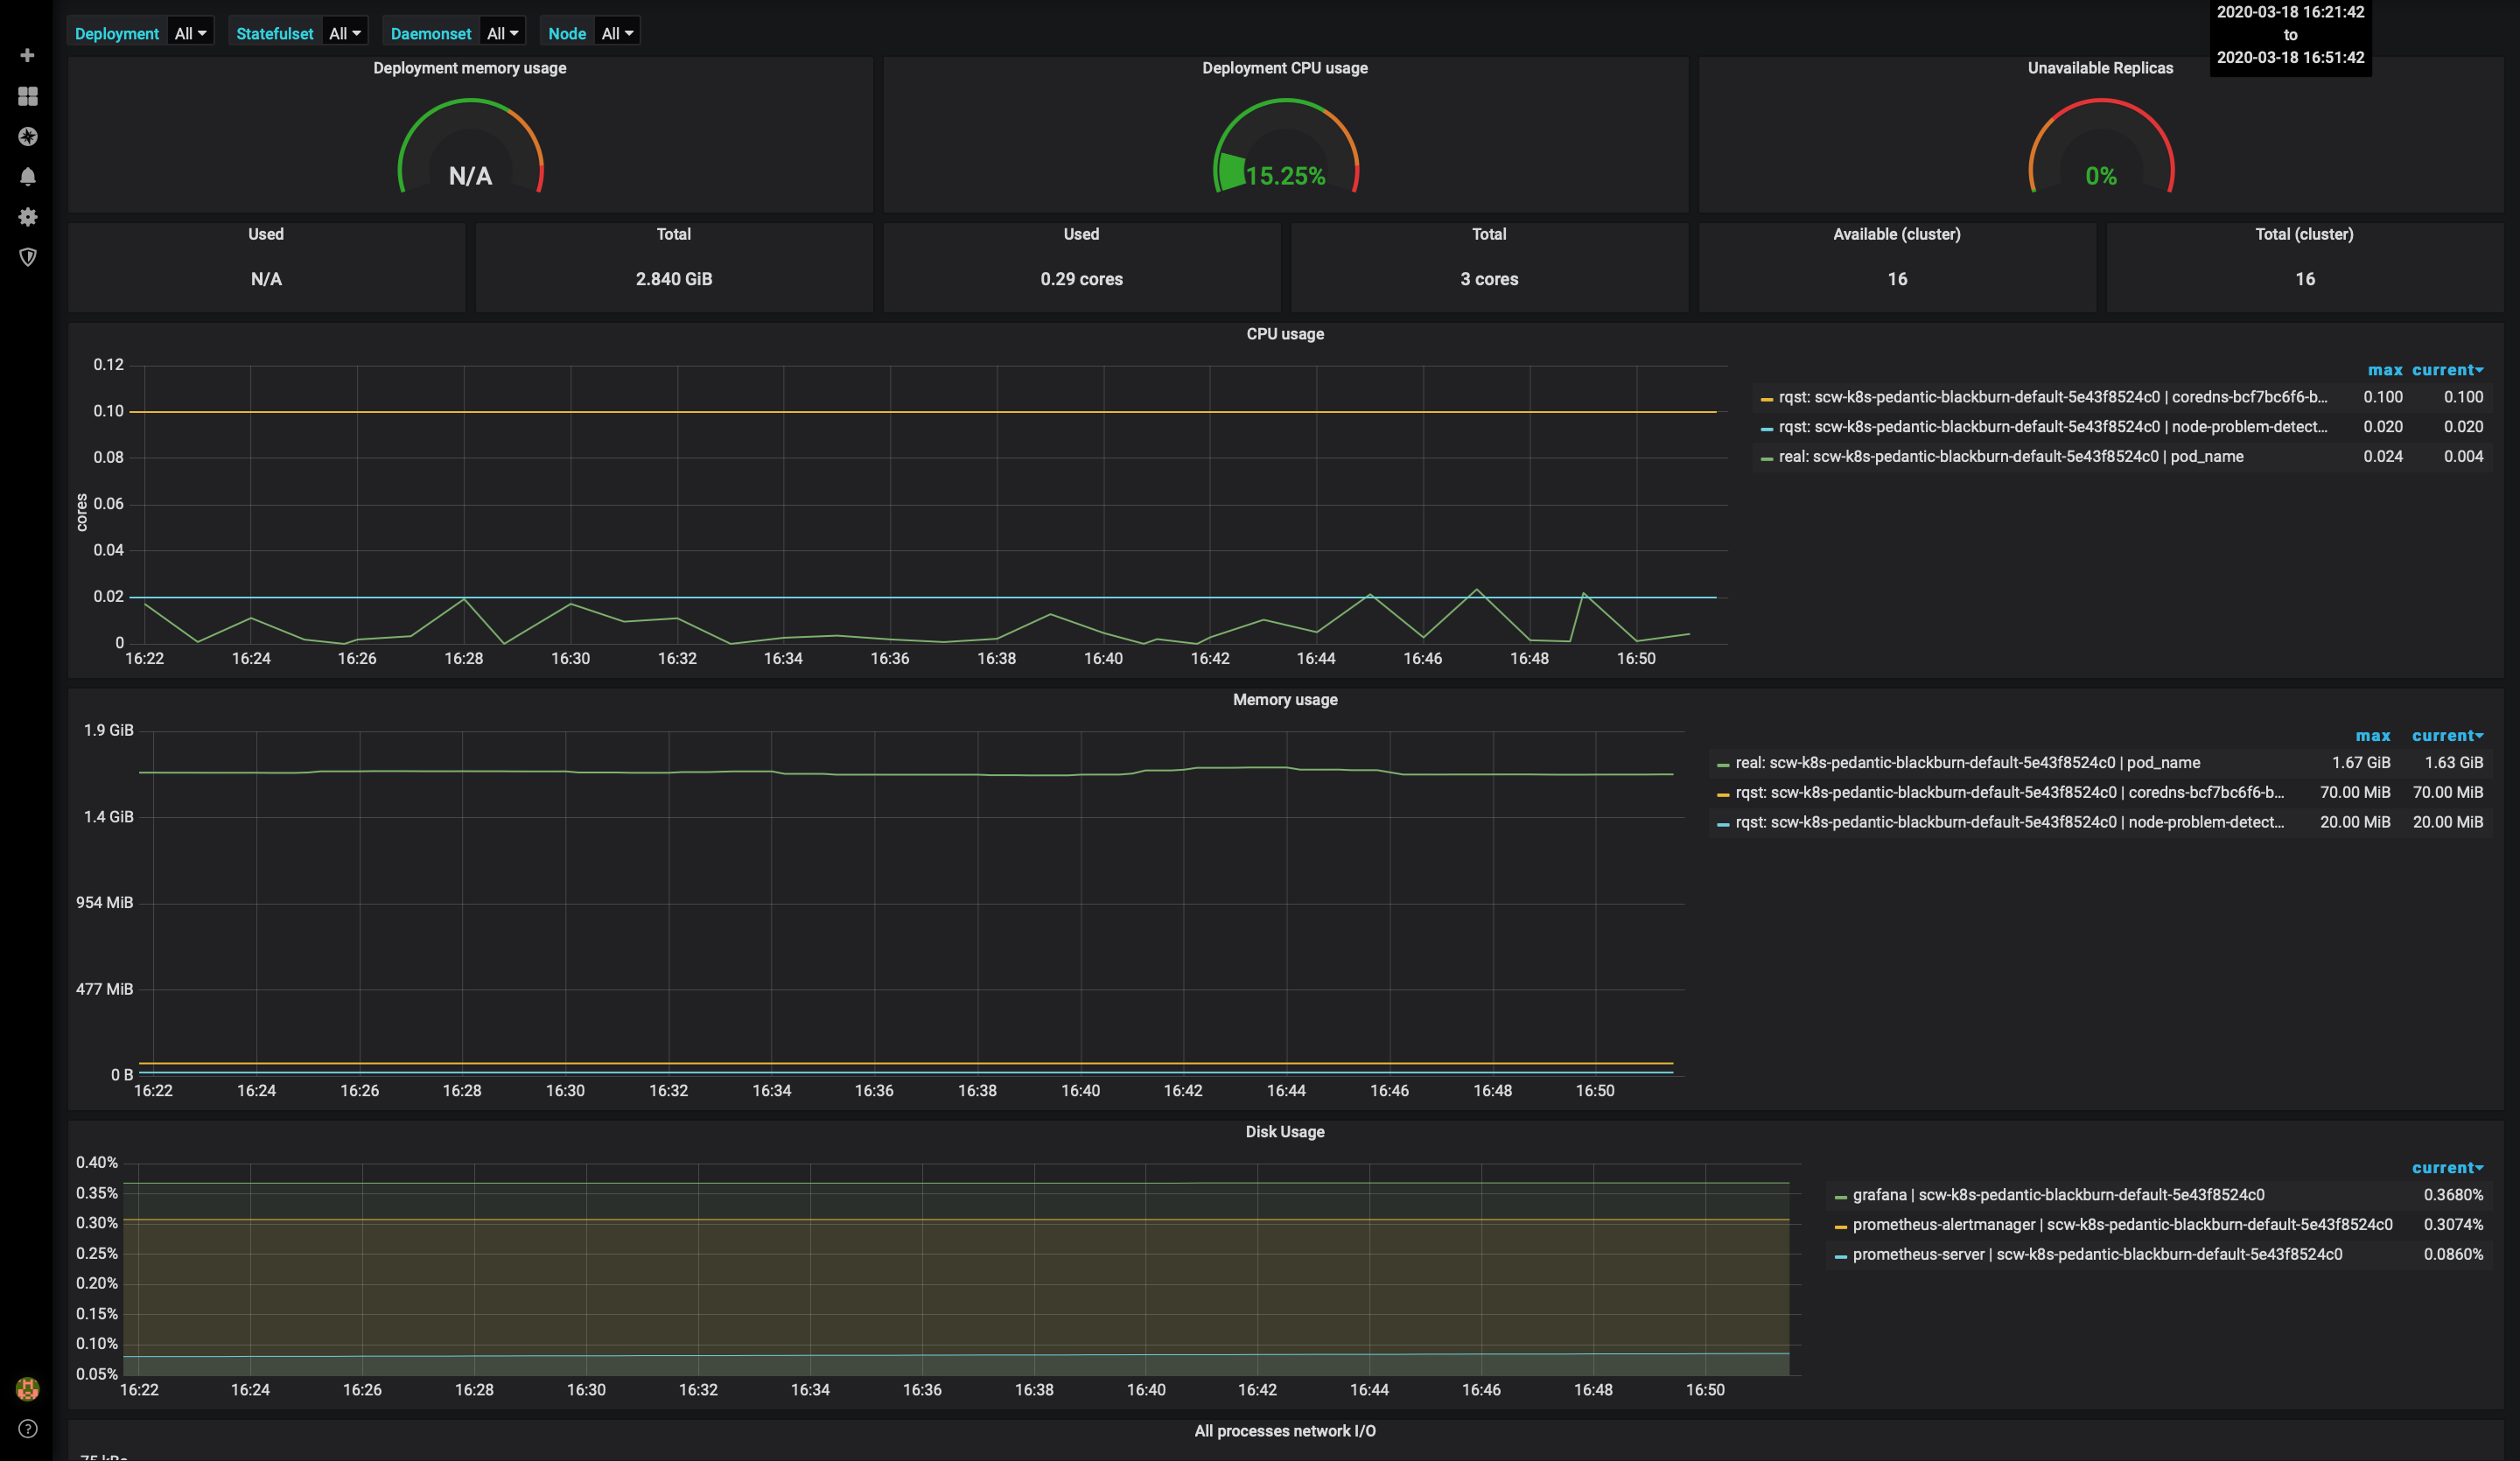
- Click the + sign and then Import to import a ready-to-use dashboard from the Grafana website. To create a dashboard that uses kube-state-metrics, import the dashboard number 8588 and get information about your Deployment, Statefulset, and Daemonset:

- Choose
Prometheusas data source and click Import.
- Access the dashboard with metrics for Deployment, Statefulset, and Daemonset:
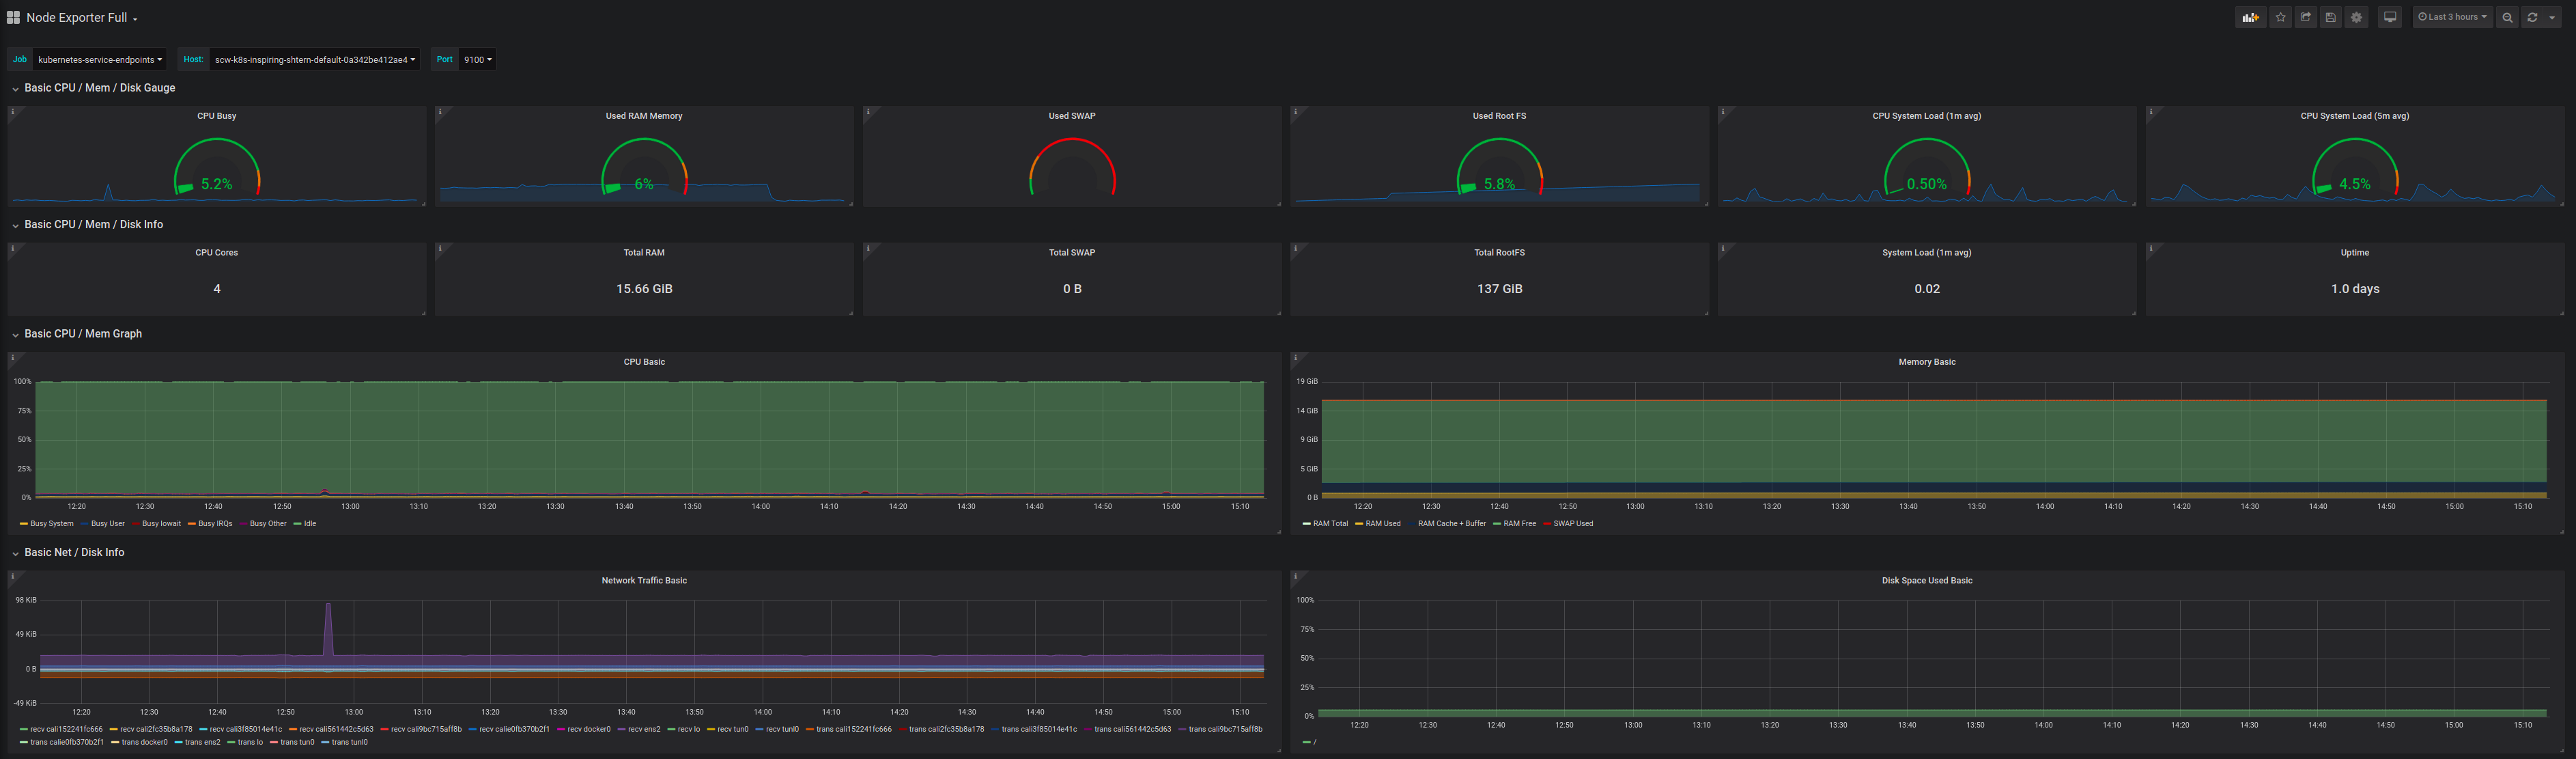
- You can also configure additional dashboards, for example, the node exporter full dashboard (1860) to display a dashboard with system metrics for each Kubernetes node:
You now have basic monitoring for your Kubernetes Kapsule cluster. For more information on how to configure your cluster, refer to the official Kubernetes documentation.
External links
Visit our Help Center and find the answers to your most frequent questions.
Visit Help Center