The digital sector generates 4% of global greenhouse emissions. Data centers and hardware are the main contributors to that impact. But those machines — not to mention all software, websites, apps and more — run on code written by developers. This means their work’s impact is far from negligible. So how can engineers, and indeed anyone shaping tech today, reduce that impact?
In part 1, we laid the foundations for a greener approach to IT, by explaining how data centers/cloud providers, hardware and software all need to be taken into consideration. In this chapter, we’ll look precisely at how their respective impacts can be measured. Because, as the saying goes, you can’t improve what you can’t measure! So let’s dive in…
The basics: Scopes 1-3
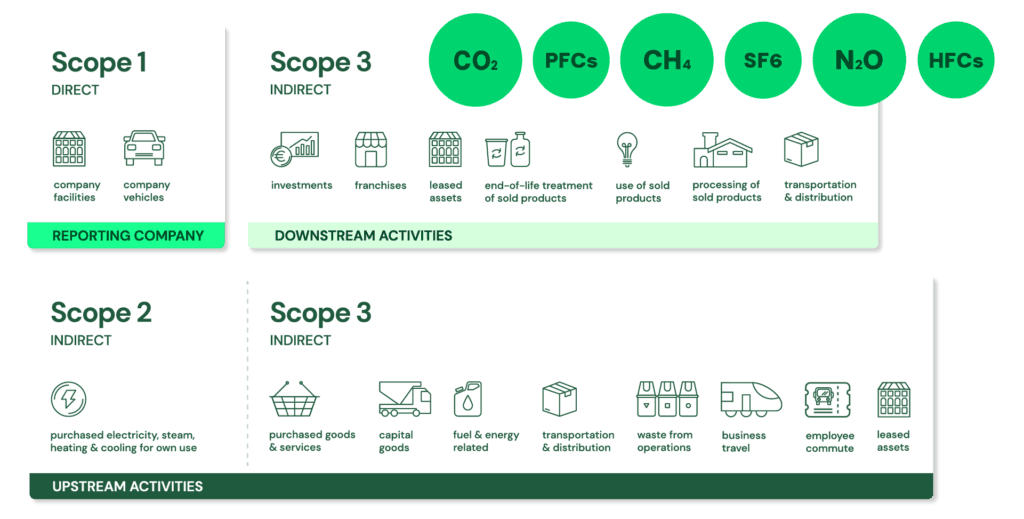
Any and all organizations looking to measure their greenhouse gas (GHG) emissions — and as of this year, impact reporting is obligatory for all European companies over 500 employees — must do so across three different domains, called “scopes”:
Scope 1: Direct emissions from sources such as offices, company cars and so on.
Scope 2: Indirect emissions from the purchase of resources such as the electricity required to run a company’s facilities
Scope 3: The emissions an organization is indirectly responsible for, both upstream and downstream. This can include employees’ commutes to the office, and even the emissions consumers generate from using that company’s products.
As such, scope 3 is the most far-reaching, and therefore by far the most difficult scope to measure.
Naturally, different stages of the digital value chain have different impacts on each scope. On one end, for example, data centers can have a high scope 2 impact, as their GHG emissions linked to energy consumption can be considerable; on the other end of the scale, hardware’s impact can go right to scope 3.
A telecom operator, for example, could be held responsible for the GHG emissions linked to the manufacturing and usage of the telephones it sells to its clients… even though it didn’t make those devices itself. Impacts can also be far-reaching geographically speaking: sticking with the telephone example, Apple’s impact runs from China, where iPhones are made, to both its offices and its consumers in the US and beyond.
So, what are the best ways to measure impact across the entire digital value chain?
How green is your cloud provider?
The first place to research your cloud service provider (CSP)’s GHG impact is… with the CSP itself! All cloud providers should have some kind of impact report, which should tell you:
- PUE, or Power Usage Effectiveness: how much energy a CSP’s data centers use, as a ratio of the energy used coming into a facility, and that used by its IT equipment. The global average is 1.57, but the closer it gets to 1, the better. Scaleway’s average is 1.4, and its minimum 1.15. All CSPs have to provide this figure publicly
- WUE, or Water Usage Effectiveness: how much water a CSP’s data centers use, as a ratio of the energy consumption. Scaleway declares the WUE of all of its French data centers. However, CSPs are not legally bound to declare this figure, so some do, some don’t. Scaleway’s average, of 0.21, is close to that of Meta (0.26). Users should be particularly wary of CSPs who don’t declare their WUE, as this may mean they’re using high quantities of water to cool their data centers, and hence lower their PUE…
- Energy mix: does your cloud provider use only renewable energy? It can, and if it does, it should say so. Similarly, is it paying attention to when and where electricity is the cleanest possible? For example, electricity in France comes mainly from nuclear and hydroelectric sources (source), so its carbon footprint is low compared with the USA, where 79% of energy comes from fossil fuels. Carbon intensity also varies depending on the time of day, so CSPs should run their biggest workloads when this intensity is lowest
- CUE, or Carbon Usage Efficiency, is the amount of GHGs (expressed in kg of CO2) emitted by data center activities, divided by the amount of energy used by a datacenter’s IT equipment, in kWh. Scaleway’s CUE is 0.075 kgCO2e/kWh (market-based) or 0.142 (location-based). And on that topic:
- Market-based emissions data is less accurate, as it’s based on emissions from electricity from sources companies have specifically chosen;
- Location-based emissions data, as recommended by the industry standard GHG Protocol, is based on the carbon intensity of data centers’ local energy grids.
Other elements that can help you evaluate your CSP’s green credentials are to what extent it reuses its hardware, and/or works to prolong its lifespan; and whether it offers “green bills”, or other similar calculators, which quantify your cloud activity’s GHG emissions impact.
Look out for specific tools, like AWS Suscanner, “an open source tool that helps you create a more sustainable infrastructure on AWS”, or OVHCloud’s “carbon calculator”, a tool currently in development, which should do what it says on the box :)
Beyond the providers themselves, a number of other tools exist to evaluate CSPs’ impact on the planet. Cloud Carbon Footprint is a highly-respected free open source tool, designed to work with the biggest CSPs and more, which “provides visibility and tooling to measure, monitor and reduce your cloud carbon emissions.”
There’s also Scaphandre, another open source tool, which measures the energy consumption of specific pieces of hardware. Although it’s only in the early stages of development right now, and only works with RAPL, Intel’s protocol for power consumption, it’s a good place to start (measuring the energy consumption of servers in a data center, for example).
Other good starting points are Boavizsta, the French tech collective specialized in measuring a wide range of hardware’s energy consumption and GHG emissions, which is currently developing a stronger focus on CSPs in particular. You can check out their cloud data to date here. It’s also worth taking a look at the cloud sustainability tips of the Green Software Foundation (or “patterns for cloud”), which range from the obvious (choose the cloud region closest to your users) to the less evident (scale down Kubernetes applications when not in use).
Hardware: measuring digital’s biggest contributor
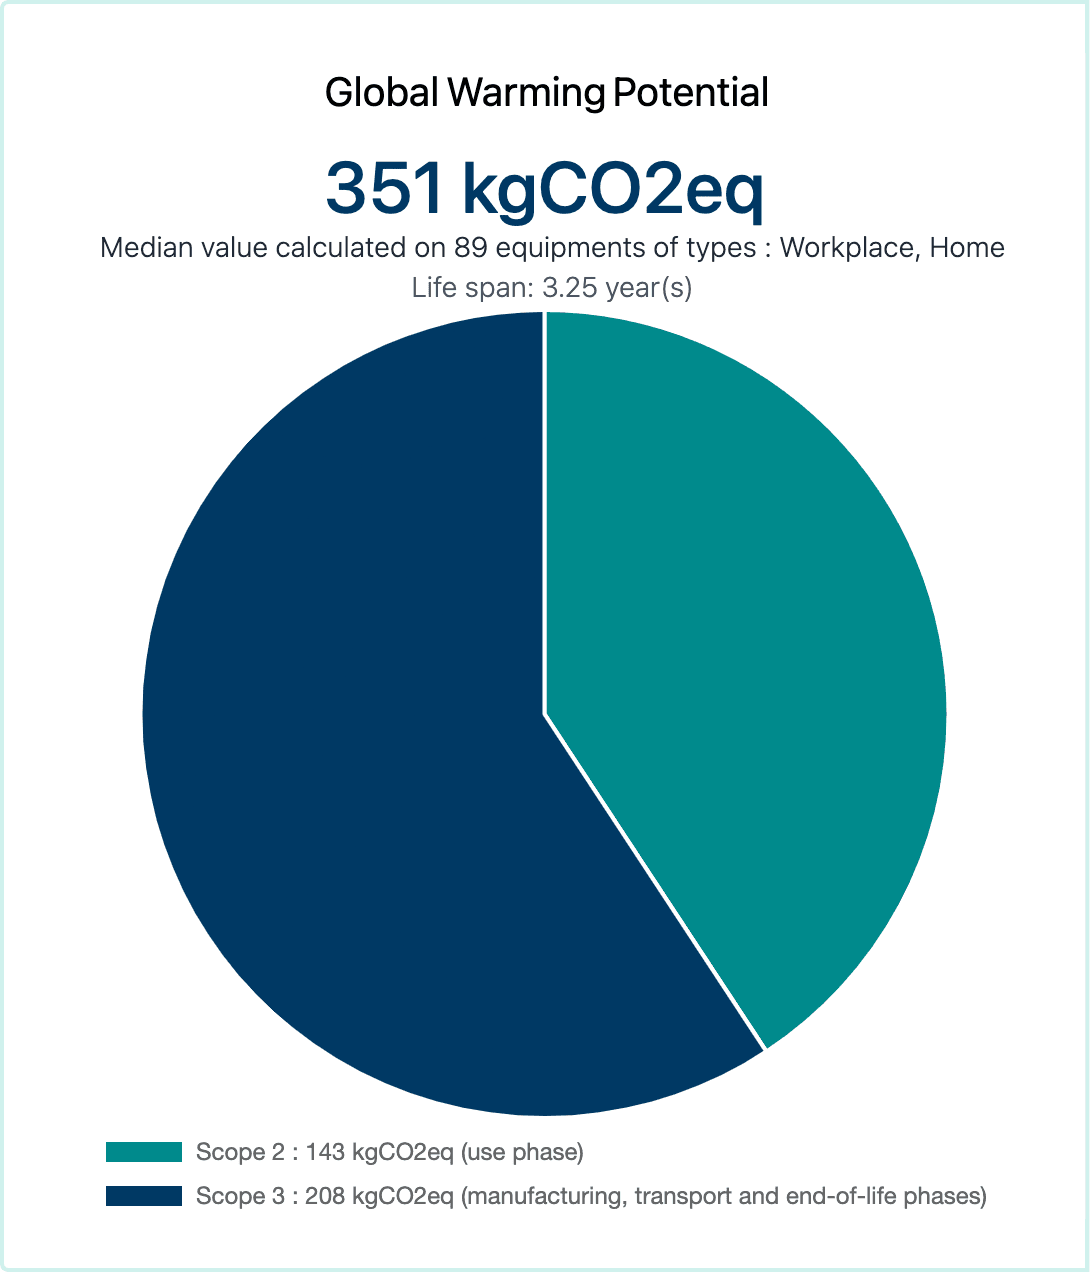
As we said in part 1, with hardware representing around three quarters of the digital sector’s GHG emissions, it’s particularly important to measure devices’ impact as closely as possible. For that, Boavizta’s Manufacturer Data Repository is a great place to start. Here, for example, is the total global warming potential of all 89 Apple products listed in its database:
It should also be noted that location is a key variable in data like that provided above: products used in a carbon-heavy electricity country like China will have more impact than those used in France, which has a relatively low carbon mix, for example. Such data should be a crucial first step when considering acquiring either new or used equipment (preferably used, of course, as the manufacturing impact is avoided in this case).
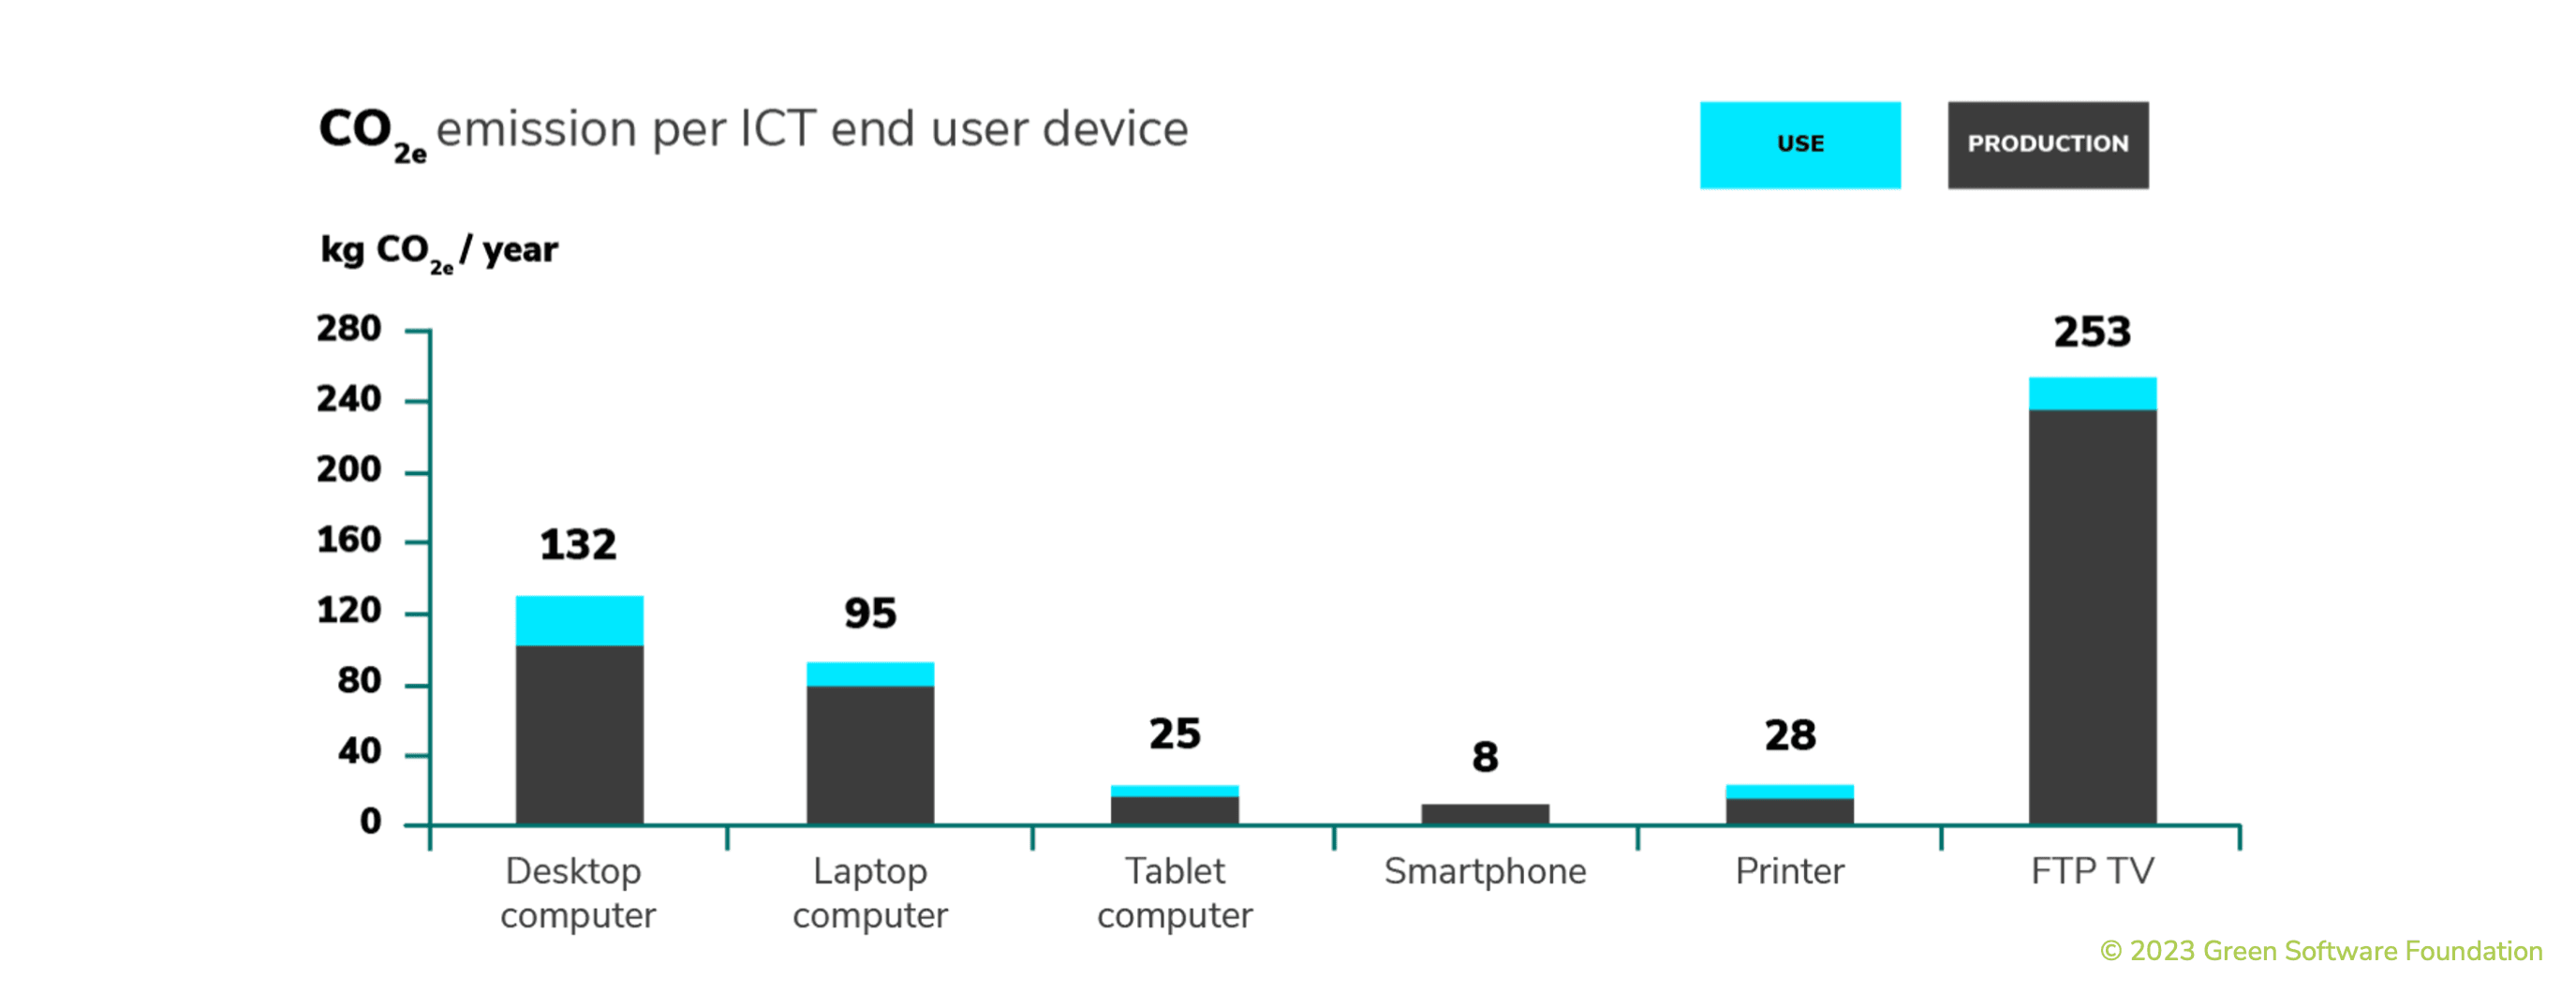
The Green Software Foundation (GSF) refers to each device’s impact as its Embodied Carbon. This refers to the CO2 emitted by a product’s manufacture and usage (pictured above by product type).
How can this be measured, and hence optimized? Very simply. To cite a GSF example, if your device has 1000 kg of embodied carbon, and its expected lifespan is 2 years, that’s 500 kg per year. If you extended the lifespan of your device to 3 years then it would be 333kg per year. It’s therefore plain that using devices for longer is one of the most impactful ways to reduce both GHG emissions, and e-waste.
Beyond these agnostic measurement tools, you can increasingly look to manufacturers for help here. Numerous tools exist — and many of them are listed here — including Intel Power Gadget, which measures the energy consumption of Intel Core processors and upwards, on Macs and Windows PCs. On Linux, you can try Powerstat, which, like many similar tools, leans on Intel’s aforementioned RAPL (Running Average Power Limit) library.
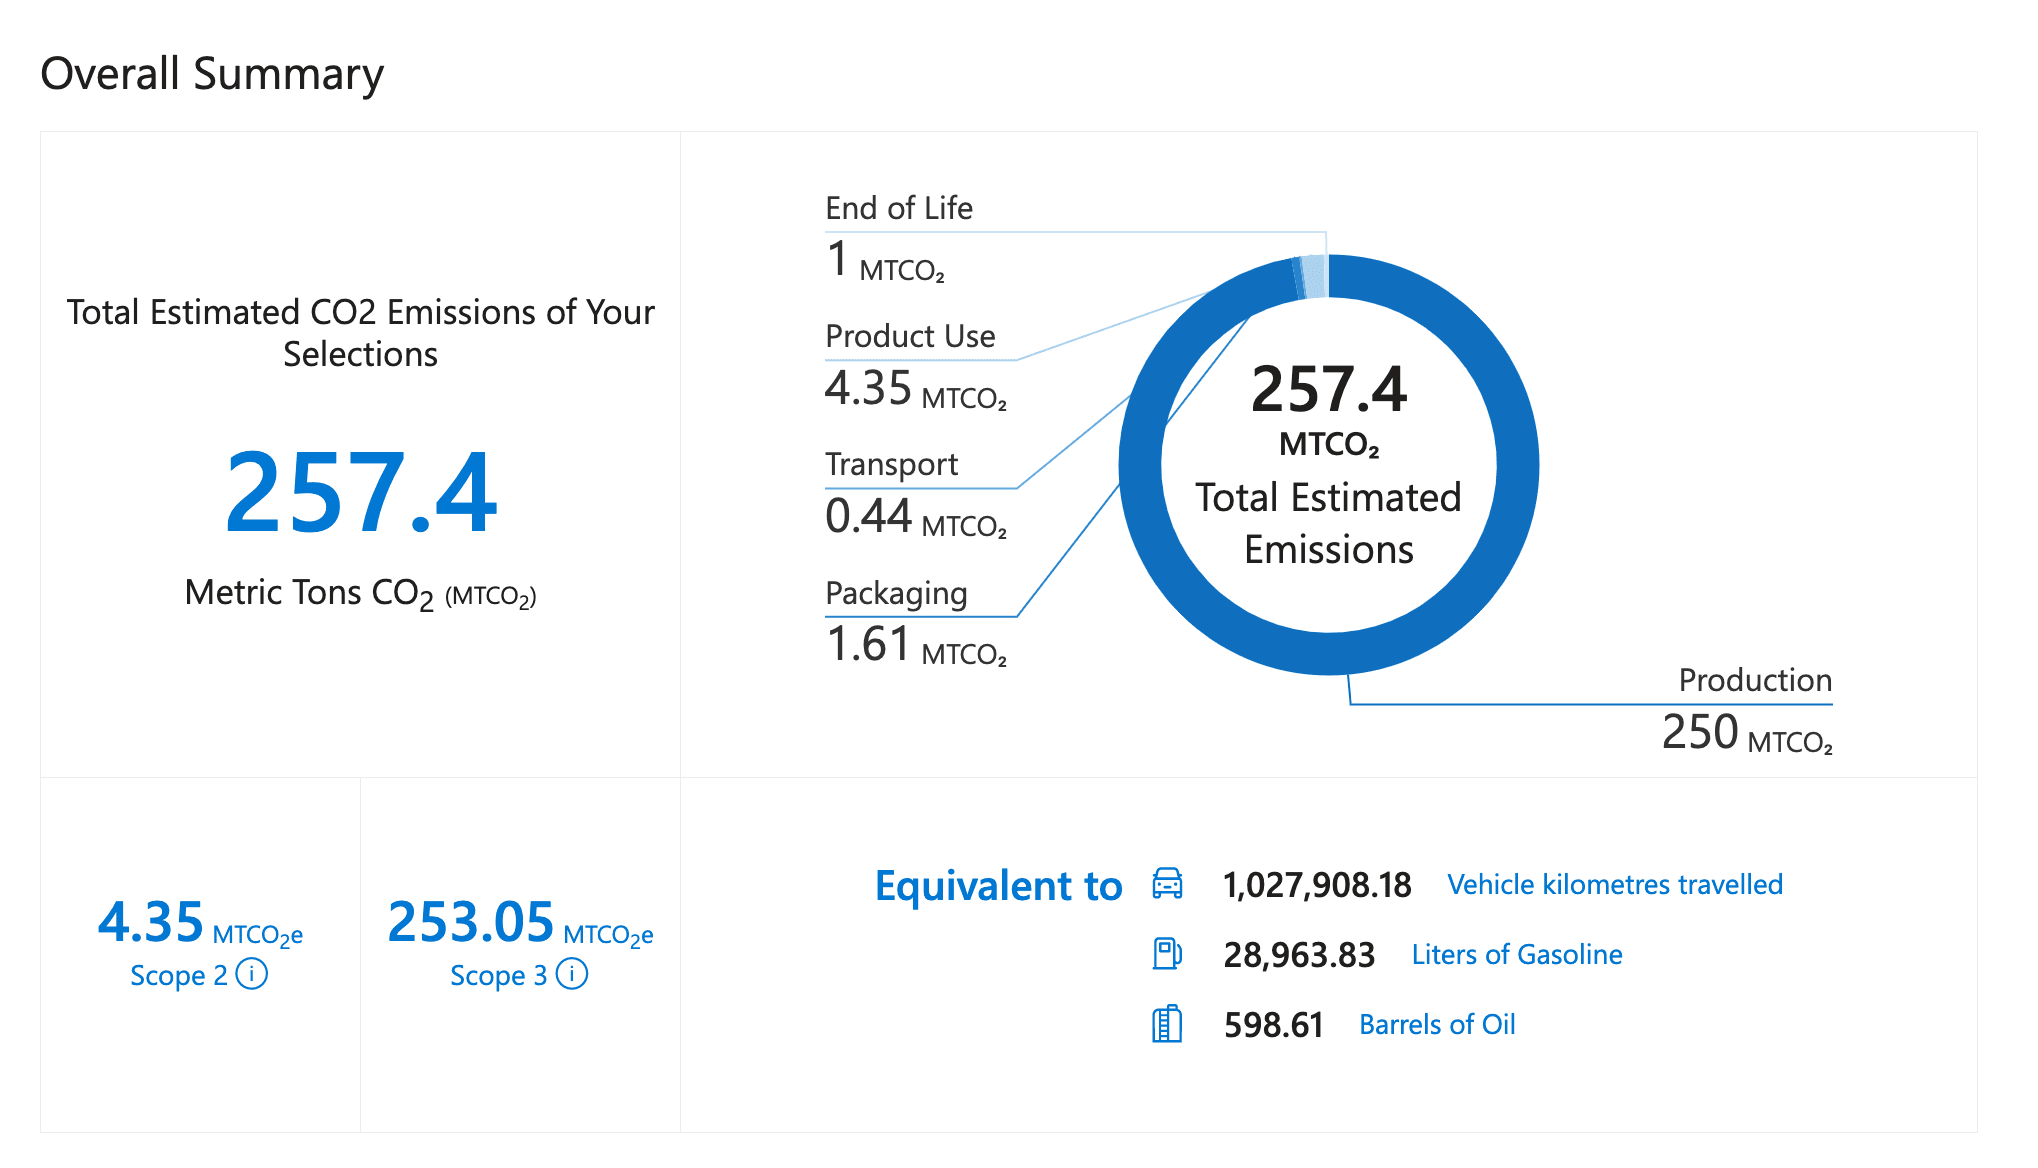
There are also more consumer-facing tools, like Microsoft’s Surface Emissions Estimator, which gives buyers a heads-up on the impact of their hardware before purchase (above is that of 1000 Surface Laptop Studio i7 devices functioning in France — which has a relatively clean energy mix — for three years). The mere indication that even in such favorable circumstances, one PC’s impact is the same as traveling over 1000km in a car gives significant pause for thought.
Software sustainability: not that hard to measure
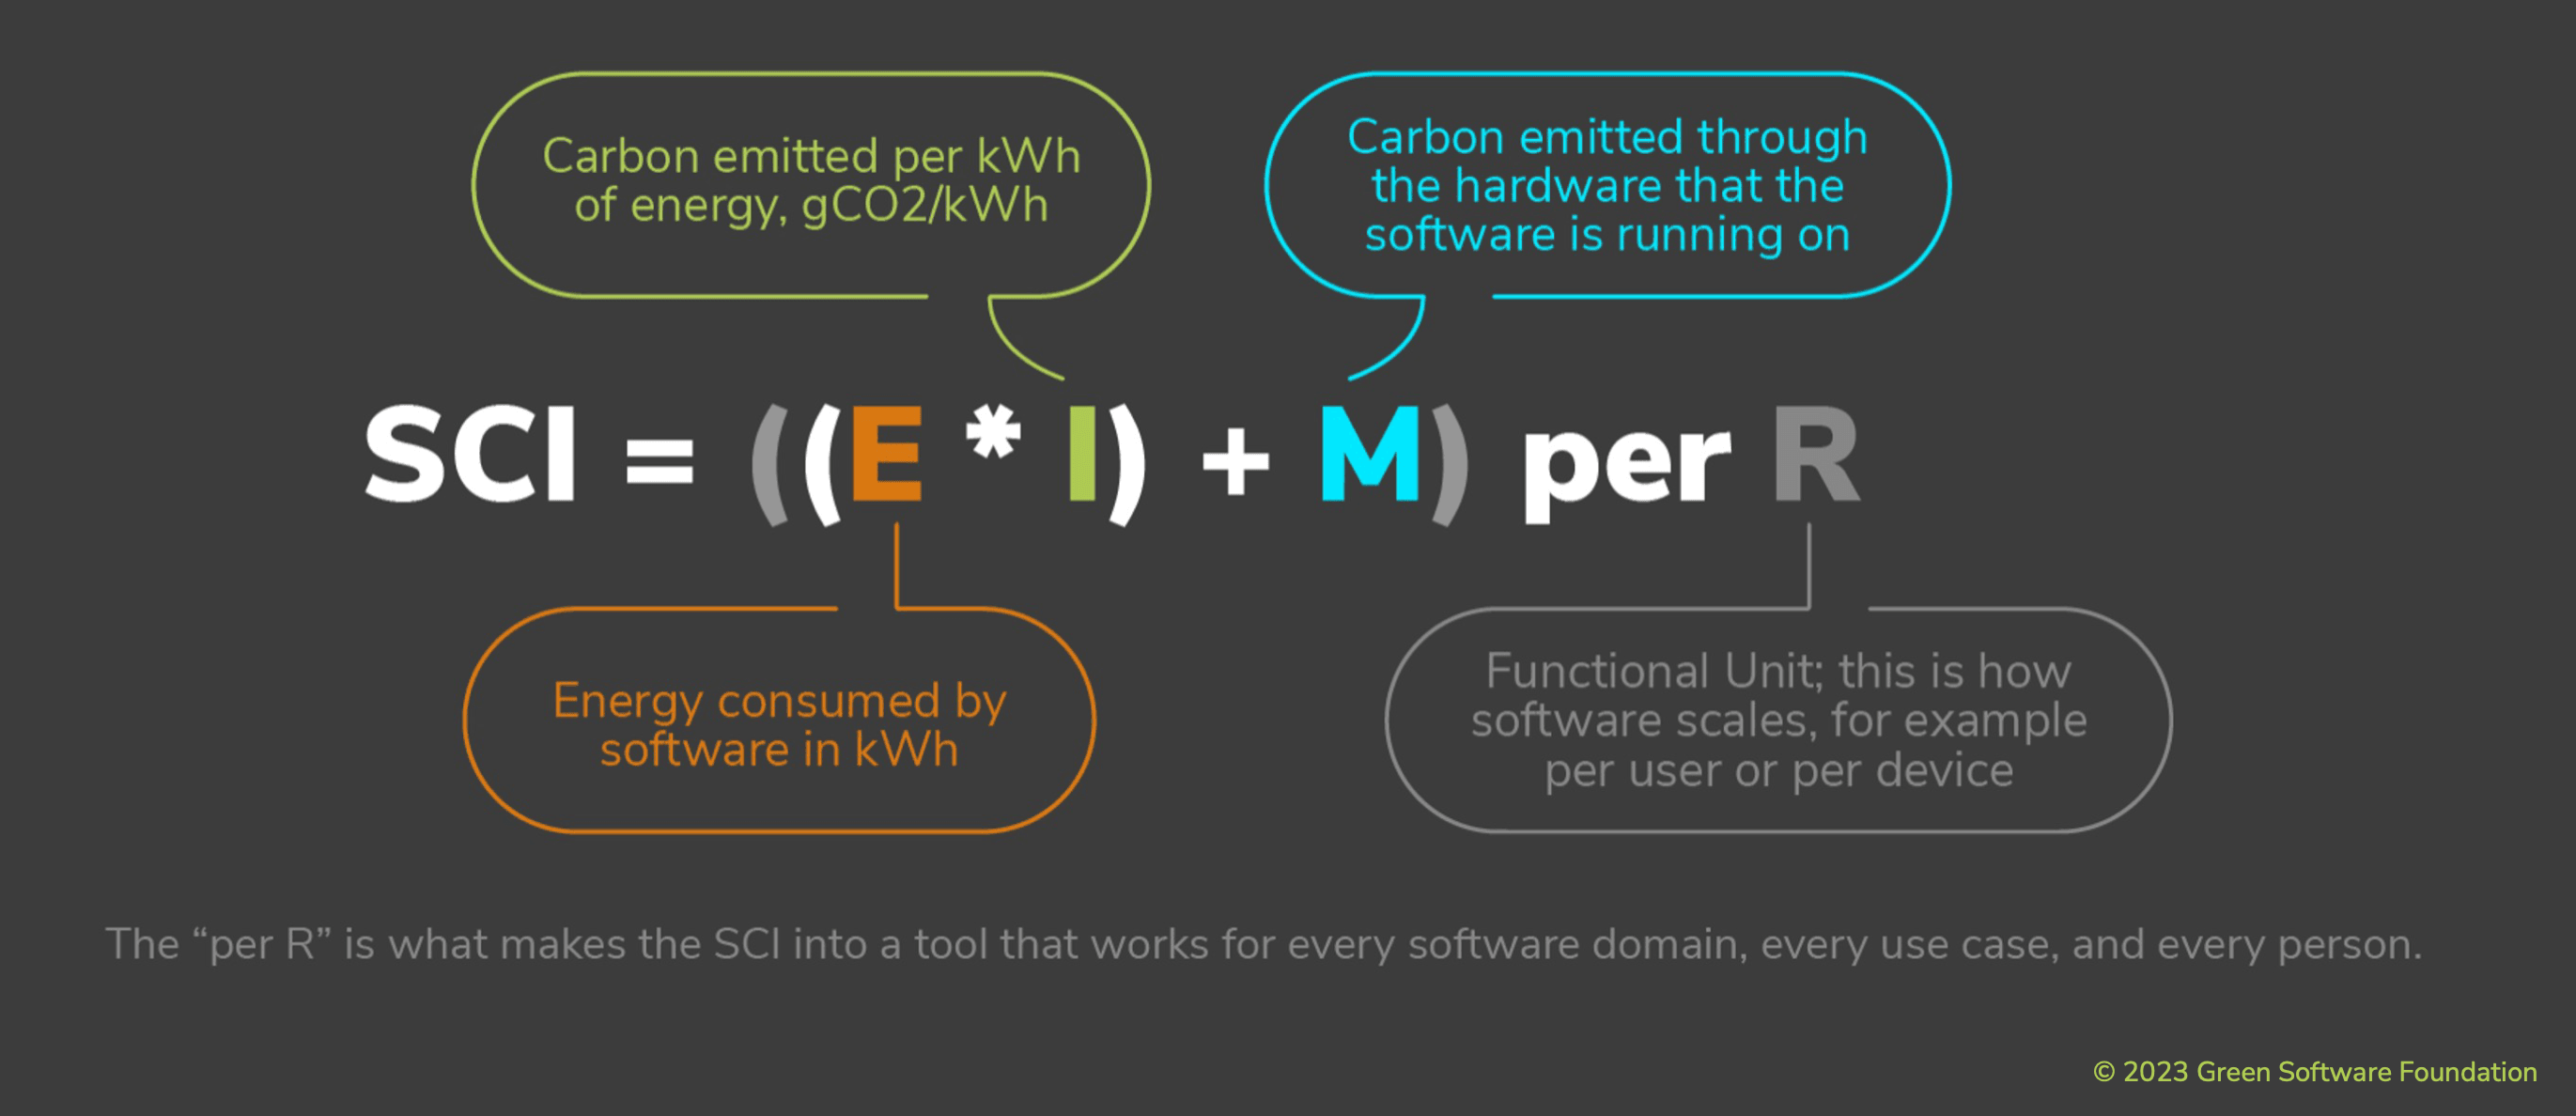
SCI, or Software Carbon Intensity, was conceived by the GSF as a way to measure software’s impact. It can be calculated like thus:
SCI can be resumed as energy consumed (E) x carbon emitted (I) per kWh (the measure of ‘cleanliness’ of the grid at any given time) plus the embodied carbon (M) of whatever hardware is being used, per number of requests, devices (R), and so on. So the lower the SCI, the better the software is for the environment.
How can SCI be worked out?
- E = can come from the energy used by the processor (cf. above) when said software is running
- I = the grid’s carbon mix (which can be calculated with tools like carbonintensity.org.uk, wattime.org or Electricitymap.org)
- M = the hardware’s embodied carbon, via Boavizsta or similar
- R = specific to each case/project.
Developers can also bear in mind Intel’s high-level tips for writing greener code when starting new projects. These include measurement as a prerequisite, and focusing on the areas with most potential for impact reduction, for example AI.
But just how sustainable is your software’s code in the first place? It’s generally agreed that “green coding” is the same as “efficient” or “clean coding”, whose principles haven’t changed in 20 or so years. Code efficiency can easily be monitored with SonarQube. Movements like the Green Code Initiative have even come up with EcoCode, a SonarQube plugin that tells you “how green is your app”... as long as it’s written in Java, JavaScript, PHP or Python.
We’ll leave aside the ongoing and still-unresolved debate about whether some code languages are greener than others — more on that here — but some principles are beyond question. For example, cyclomatic complexity, or the number of paths through a piece of software’s source code, should be kept to a minimum. If, for example, your website needs to generate a different form for each gender, that will increase its code’s cyclomatic complexity, and therefore its energy usage.
Bloatware should also be avoided, for similar reasons. If 90% of your software’s functionalities aren’t used, they’re obviously going to consume unnecessary resources. It's also worth noting here how some of the world’s most popular software tends to get bigger and bigger: Windows 11 (2021), for example, takes up 42 times more disk space than Windows XP (2001).
Like hardware, software should also reuse existing tech/code as far as possible, and last for as long as possible, to avoid hardware obsolescence.
Last but not least, again for resource optimization, software should only process the precise quantity and quality of data it needs to function. No more, no less! Data formats can play a useful role here: JSON or YAML datasets take up a lot less space, for example, than XML ones.
Discover more green coding principles in detail here (doc in French, désolé!)
Websites: the keys to ecodesign
Applying similar principles to those mentioned above can work wonders for your website. Put simply, the cleaner your site is coded, the better it is for the environment.
Unfortunately, this hasn’t been the case globally speaking of late: the average website page weight has jumped by 191% in the past 10 years, meaning more resources, including energy, are consumed.
Fortunately, there are ways to reduce this. As EcoIndex, a free website efficiency measurement tool developed by France’s Green IT association indicates, a website’s energy efficiency can be measured across three main criteria:
- Page weight: principally influenced by the size of larger elements like images or videos
- Complexity: essentially, the number of DOM (Document Object Model) elements
- Requests: the number of HTTP requests made by the page.
EcoIndex evaluates all of these points to give your website an efficiency score; a useful first step if you’re looking to reduce its impact.
To go one step further, you can ask for a paid analysis, by a company like Orange Business. Their EcoPerf platform analyzes your site based on EcoIndex’s 3 criteria, and adds 29 more, for a more complete analysis that also gives an “ecodesign” rating. This total of 32 criteria is inspired by France’s [RGESN], or General Reference for Digital Services’ Eco-conception, which is set to become the European standard for green digital design.
Neither EcoIndex nor EcoPerf, however, look at where or how your website is hosted, another key factor of its impact. For this, The Green Web Foundation’s website will be able to tell you if your website is “hosted green” - i.e. by a cloud provider making efforts to reduce its environmental impact.
Once you’ve decided to eco-design your website, the Green Software Foundation offers patterns to anticipate key principles — like optimizing image and DOM sizes — then tools like Globemallow give you real-time analyses of each of your website’s pages, as you create them.
Why bother, though? According to Orange Business’ Aymeric Belveze, eco-designed websites:
- Have reduced carbon impact of 30 to 60%, helping your company reduce its scope 3 emissions
- Use less energy, therefore lower your cloud bill (Dalkia, for example, went from 7 servers to 2 for its website hosting, simply by applying green design principles, says Belveze)
- Have better SEO, as they load faster (a key criteria of Google’s “Core Web Vitals”)
- Are simpler, therefore easier and less costly to maintain
- Anticipate EU regulations, which could ultimately impose eco-design principles on all companies.
Web developers, you know what to do next!
In the next chapter of “How can engineers make IT more sustainable?”, we’ll provide a number of concrete case studies demonstrating the real difference greener coding principles can make. Meanwhile, feel free to check out part 1 here.
This blogpost is extracted from the Scaleway white paper "How can engineers make IT more sustainable?", which you can download in full for free here!


