
How can engineers make IT more sustainable? Part 2: How, why and what to measure
You can't improve what you can't measure. The good news: you can, when it comes to cloud, hardware, software and website energy consumption. Let's go!

The measurement of application energy consumption is a current and critical topic, both for raising awareness and for optimization purposes. In this article, we will introduce Scaphandre, an open-source tool addressing this measurement challenge, and its application in a Kubernetes Kosmos context.
Scaphandre is an open-source project licensed under Apache 2.0 that has gained popularity with over 1.3k stars on GitHub by the end of 2023. Created and maintained by @bpetit and other contributors, it is written in Rust.
The primary goal of Scaphandre is to foster collaboration between tech companies and enthusiasts around a simple, robust, lightweight, and clear method of measuring energy consumption for informed decision-making (source).
In addition to metric collection, one of Scaphandre's strengths is its ability to expose Prometheus metrics, seamlessly integrating with observability stacks. Here is the project's example dashboard:
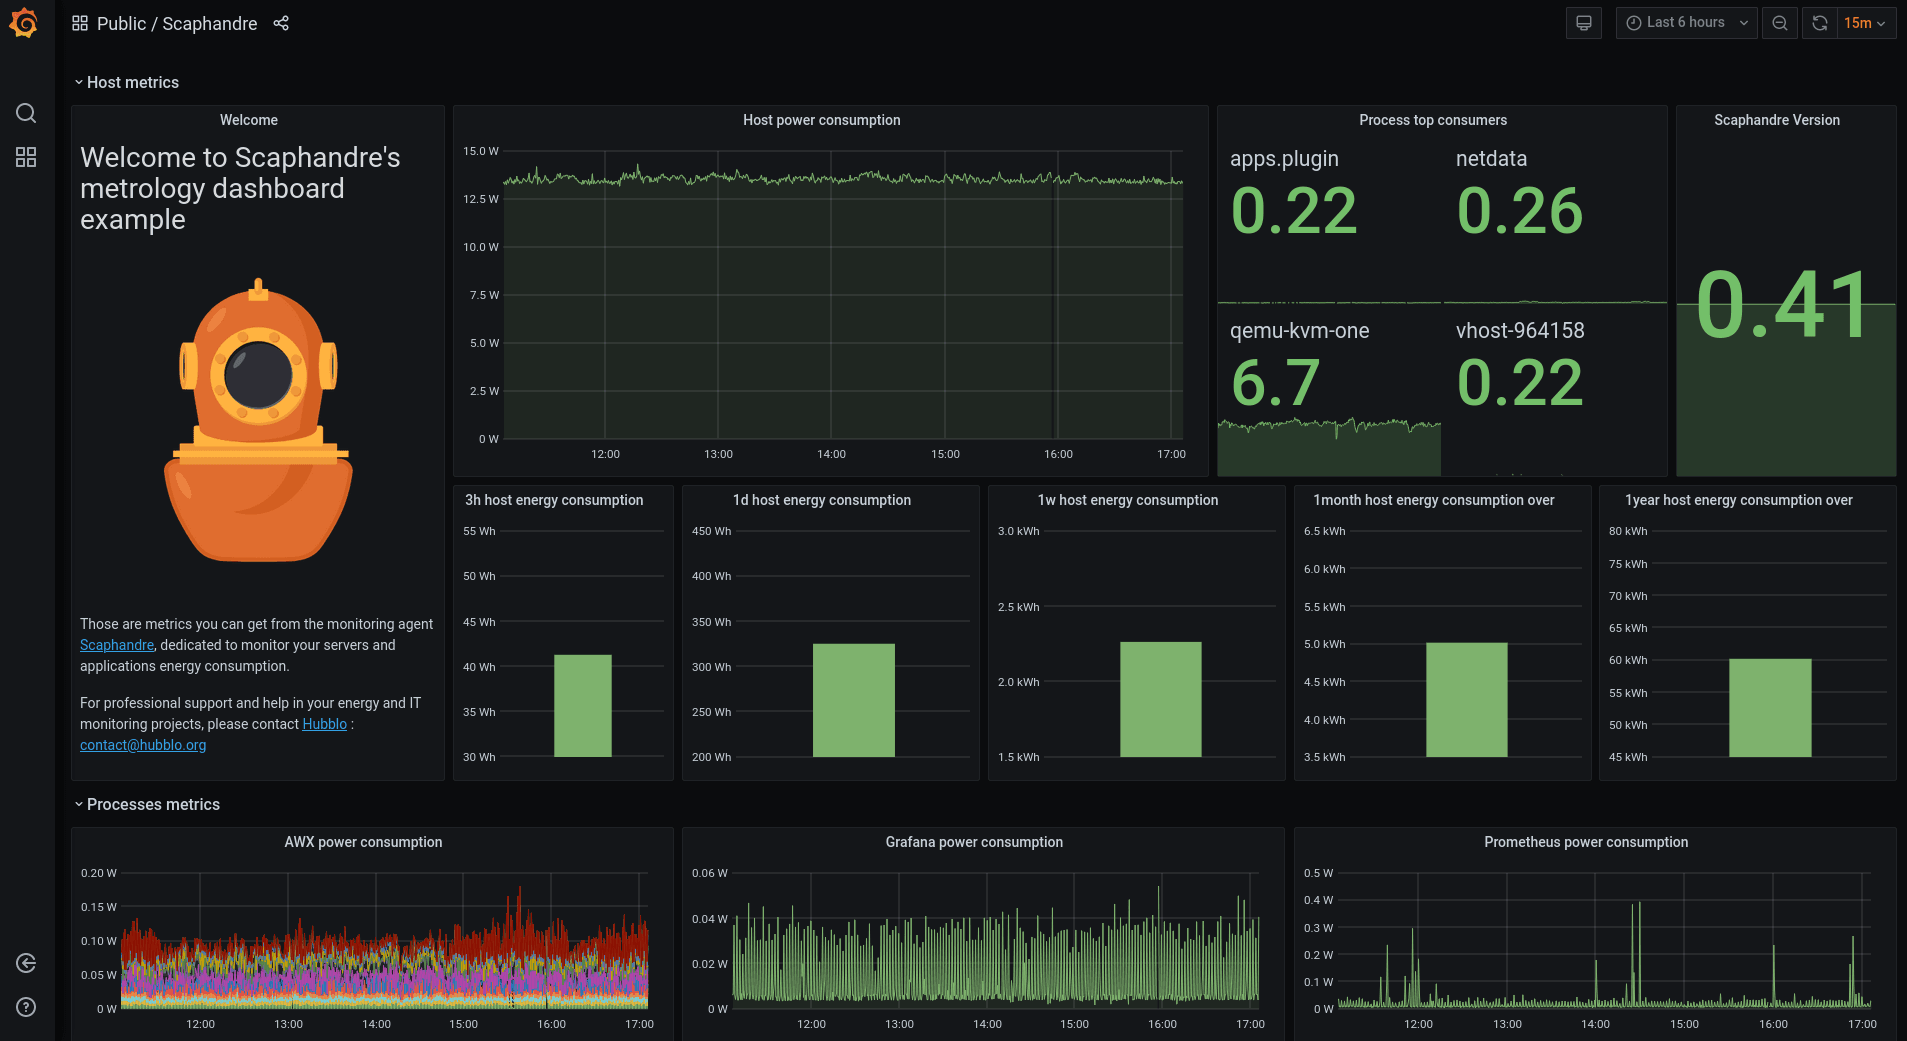
On this dashboard, we visualize the electrical power consumed by the processes of the machine on which Scaphandre is installed, as well as its conversion into the quantity of energy consumed over time intervals.
In summary, Scaphandre offers the following features:
However, Scaphandre comes with some constraints, particularly related to implemented sensors:
/proc/ and /sys/. This access is typically possible only on machines you own, especially for /sys/, unless your cloud provider shares hypervisor metrics with instances through metric propagation.To use Scaphandre in a Kubernetes context, you need a cluster that meets the mentioned constraints. We utilized the Scaleway Kosmos solution, enabling easy creation of a Kubernetes cluster with an Elastic Metal node for Scaphandre measurements.
In order to deploy Scaphandre in a Kubernetes Scaleway environment, you must have checked these prerequisites:
For our POC, we used the Scaphandre development branch and performed manual actions to address open issues on the project:
ServiceMonitor object, causing an issue with the kube-prometheus-stack deployed in "default" mode.release: kube-prometheus-stack manually to the deployed object or in the Chart before deployment.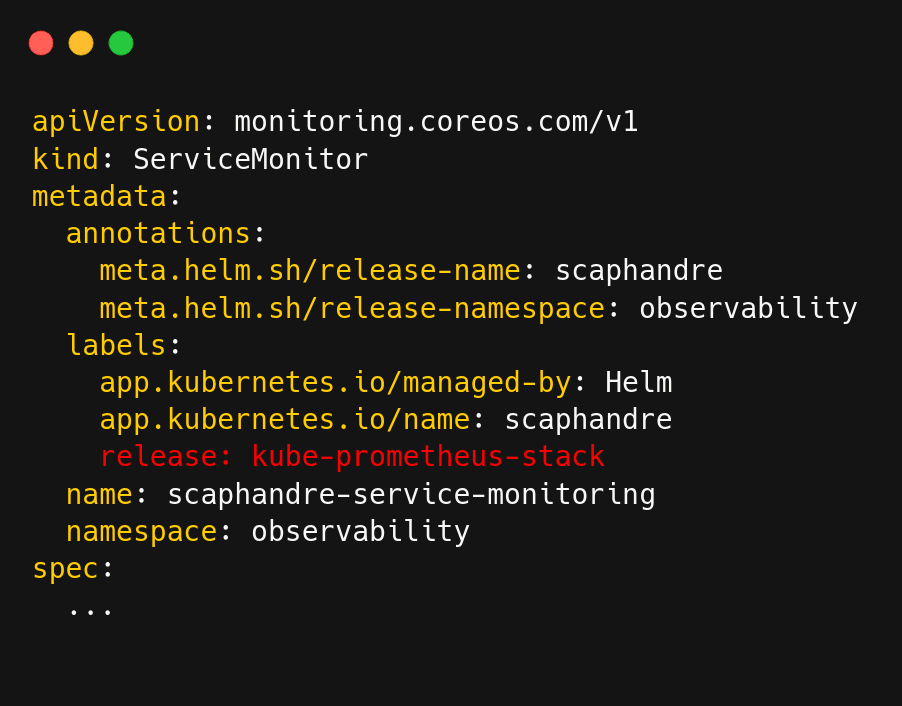
NodeAffinity is not yet supported in the current Chart.First of all, we need an observability stack installed in our cluster. We use the kube-prometheus-stack which makes it easy to have Prometheus and Grafana:
helm repo add prometheus-community https://prometheus-community.github.io/helm-chartshelm repo updatehelm install kube-prometheus-stack prometheus-community/kube-prometheus-stack --namespace observabilityLet's start by deploying Scaphandre in our cluster using the project's Chart:
git clone https://github.com/hubblo-org/scaphandregit switch devcd scaphandrehelm install scaphandre helm/scaphandre \ --set serviceMonitor.enabled=true \ --set serviceMonitor.namespace=observability \ --set serviceMonitor.interval=30s \ --namespace observabilityTo carry out our tests, we need an application to measure its consumption, ideally with several pods to have nice visualizations. We chose to deploy the Google online boutique demo microservice application in the cluster.
You might not need to deploy Scaphandre on all nodes, for e.g. :
This chapter helps you deploy Scaphandre and your applications accordingly.
Using the same principles as described here, you can label the dedicated Scaleway node in the following way:
kubectl get nodes
Identify the nodes that meet the prerequisites, then apply a label:
kubectl label nodes scw-k8s-metal-pool-metal-{ID} powercap_rapl=true
This labeling allows you to condition the deployment of Scaphandre and your monitoring applications.
For Scaphandre, depending on the current version, you might need to additionally add node selection in the DaemonSet template of the Helm chart before deploying.
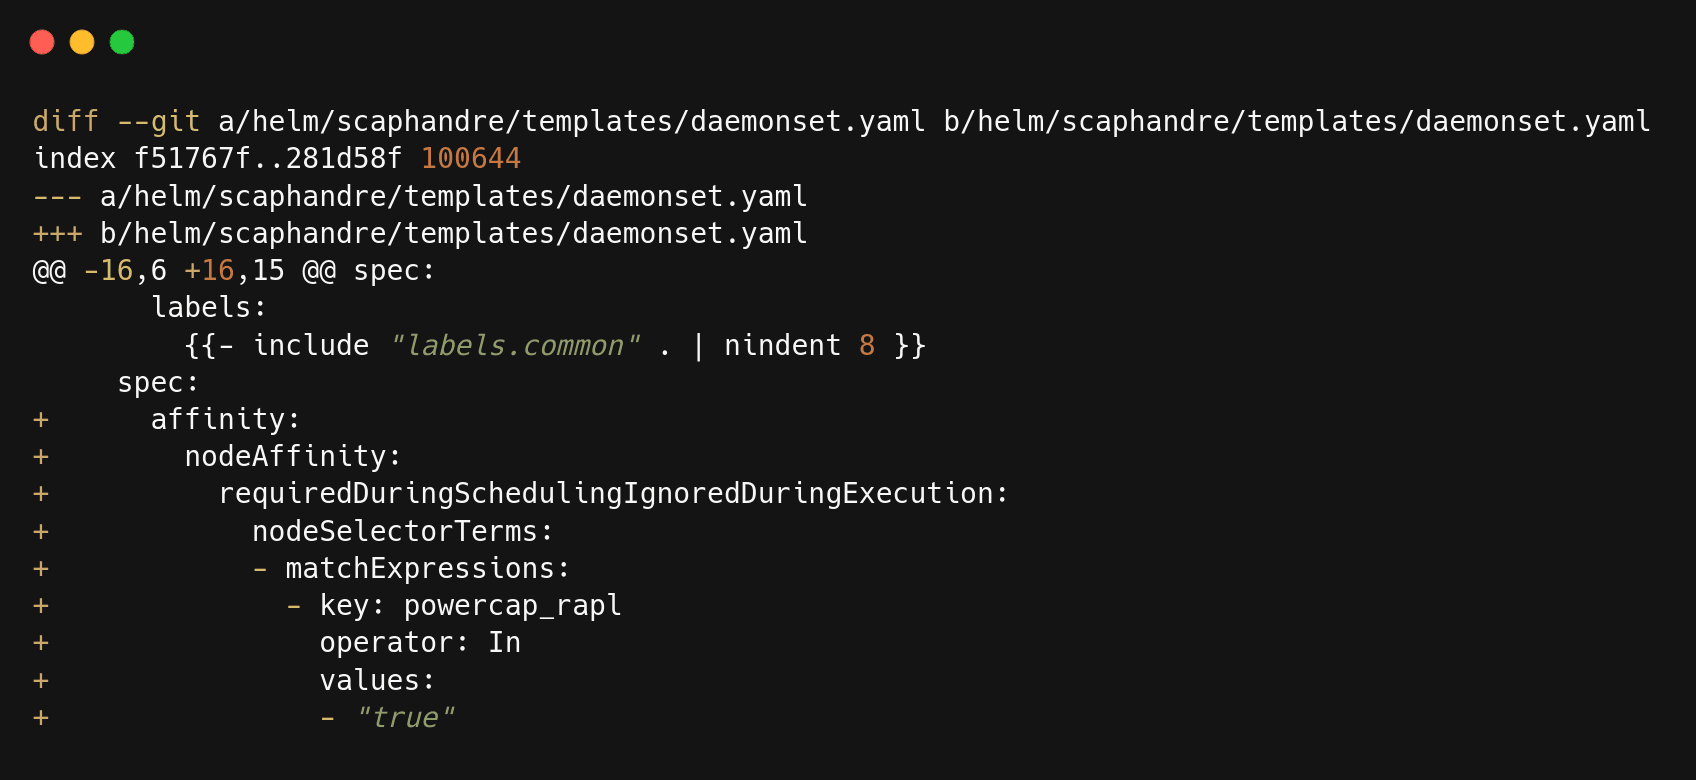
You will need to perform a similar type of manipulation for all the applications you want to bring under the monitoring of Scaphandre, using:
NodeSelector: This allows you to constrain which nodes your pod is eligible to be scheduled based on node labels.NodeAffinity: This allows you to constrain which nodes your pod is eligible to be scheduled based on node affinity rules.PodAffinity: This allows you to constrain which nodes your pod is eligible to be scheduled based on affinity to other pods. For example, if you want a pod to be scheduled on nodes where Scaphandre is running.Now that we have our functional Kube Scaphandre context, along with our observability stack and sample application, we can move on to the goal of this article: attempting to "measure" the energy consumption of our application.
Firstly, let's clarify the two main metrics exposed by Scaphandre: scaph_host_power_microwatts and scaph_process_power_consumption_microwatts. The first provides real-time power consumption in watts for the machine. The second provides real-time power consumption in watts for each process, with a value per PID on the machine.
These raw data do not directly reflect the power needed to operate the CPU. To align as closely as possible with reality, we multiply the Scaphandre metrics by the PUE (Power Usage Effectiveness), which is the ratio between the total power consumed by the data center and the portion actually consumed by the IT systems. This gives us an estimation of the power consumed by our server and the processes running on it, relatively close to reality.
The measurements we have are in the form of Prometheus metrics, so we can easily visualize them on Grafana:
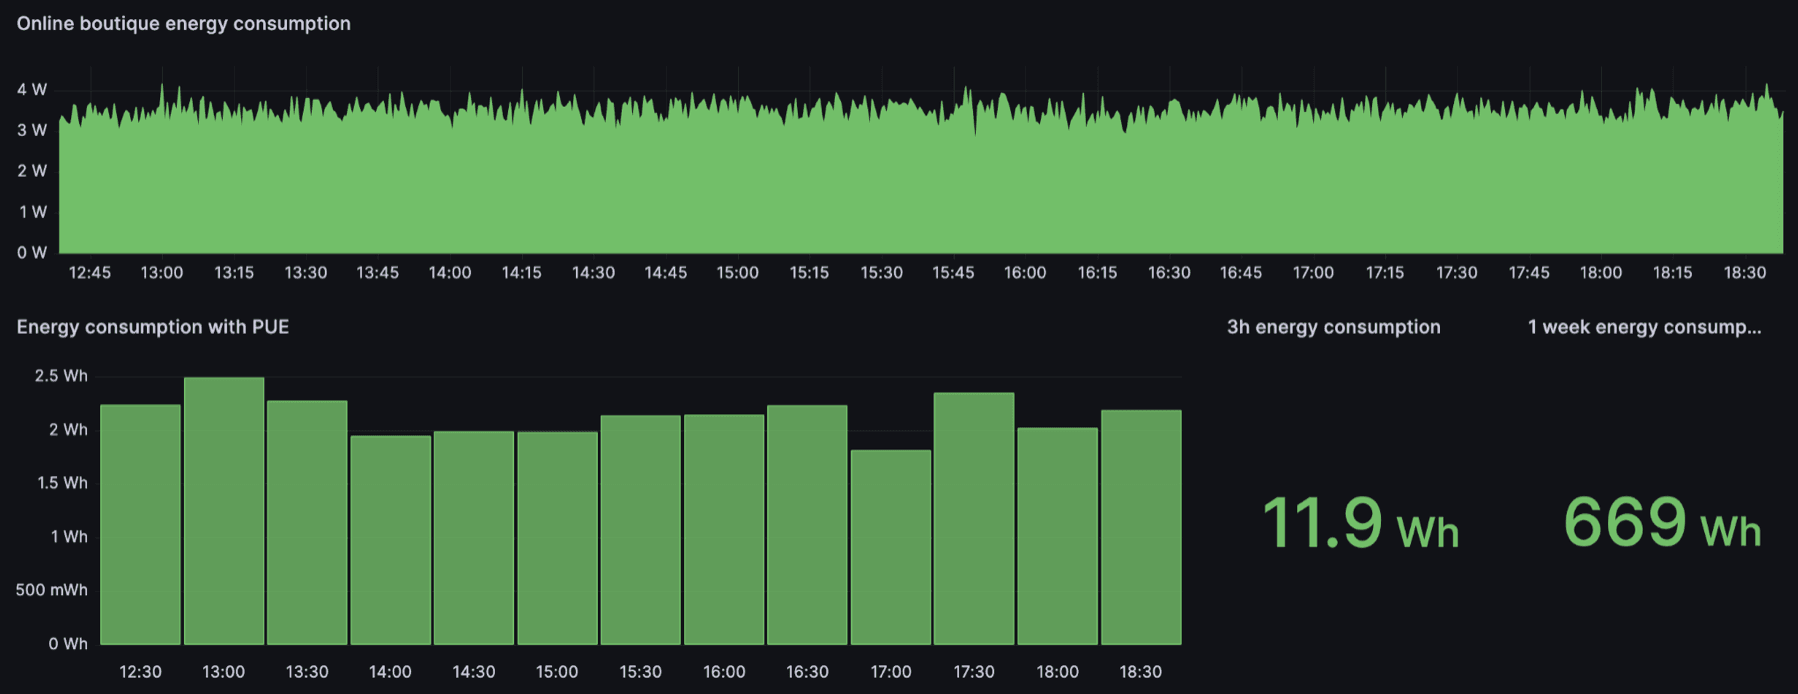
The first visualization depicts the evolution of power consumption in watts by our onlineboutique application. From this power measurement, we can derive energy in watt-hours over various time intervals.
If Scaphandre is deployed with the --containers option and installed on a Kubernetes node, it enriches metrics with the pod's name and namespace, facilitating filtering by namespace or pod. In this example, we visualize power consumption by each pod in the onlineboutique namespace.
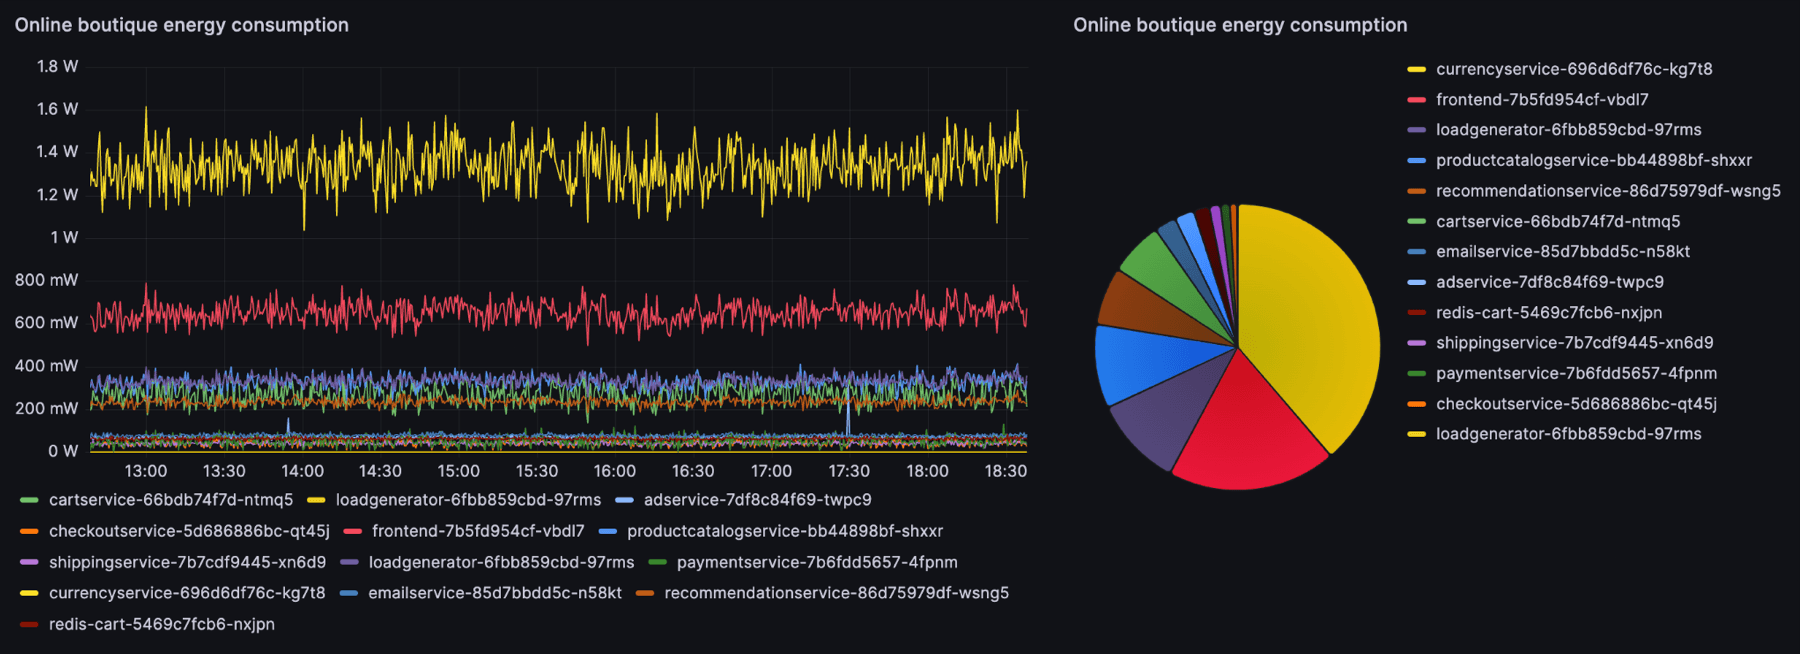
These visualizations are insightful, revealing information like the most consuming microservice, the impact of load spikes, evolution after a release, and more.
To go further, it is known that one of the first GreenOps actions to implement is to run heavy processes (such as ML training or database migrations) at times of the day when electricity is at low carbon intensity (gCO₂eq/kWh). This is the principle of off-peak and peak hours with which we are all familiar. It is possible to add this notion to our dashboard for measuring the consumption of our application. We add a Prometheus metric of the carbon intensity of France, thanks to the ElectricityMaps API, and by multiplying this metric with the Scaphandre metric (with PUE taken into account), we obtain the CO₂ equivalent of our application. The code we used to create the carbon intensity metric can be found in this repository. We note, for example, that at constant electricity consumption, CO₂ equivalent emissions are not constant and vary according to carbon intensity.
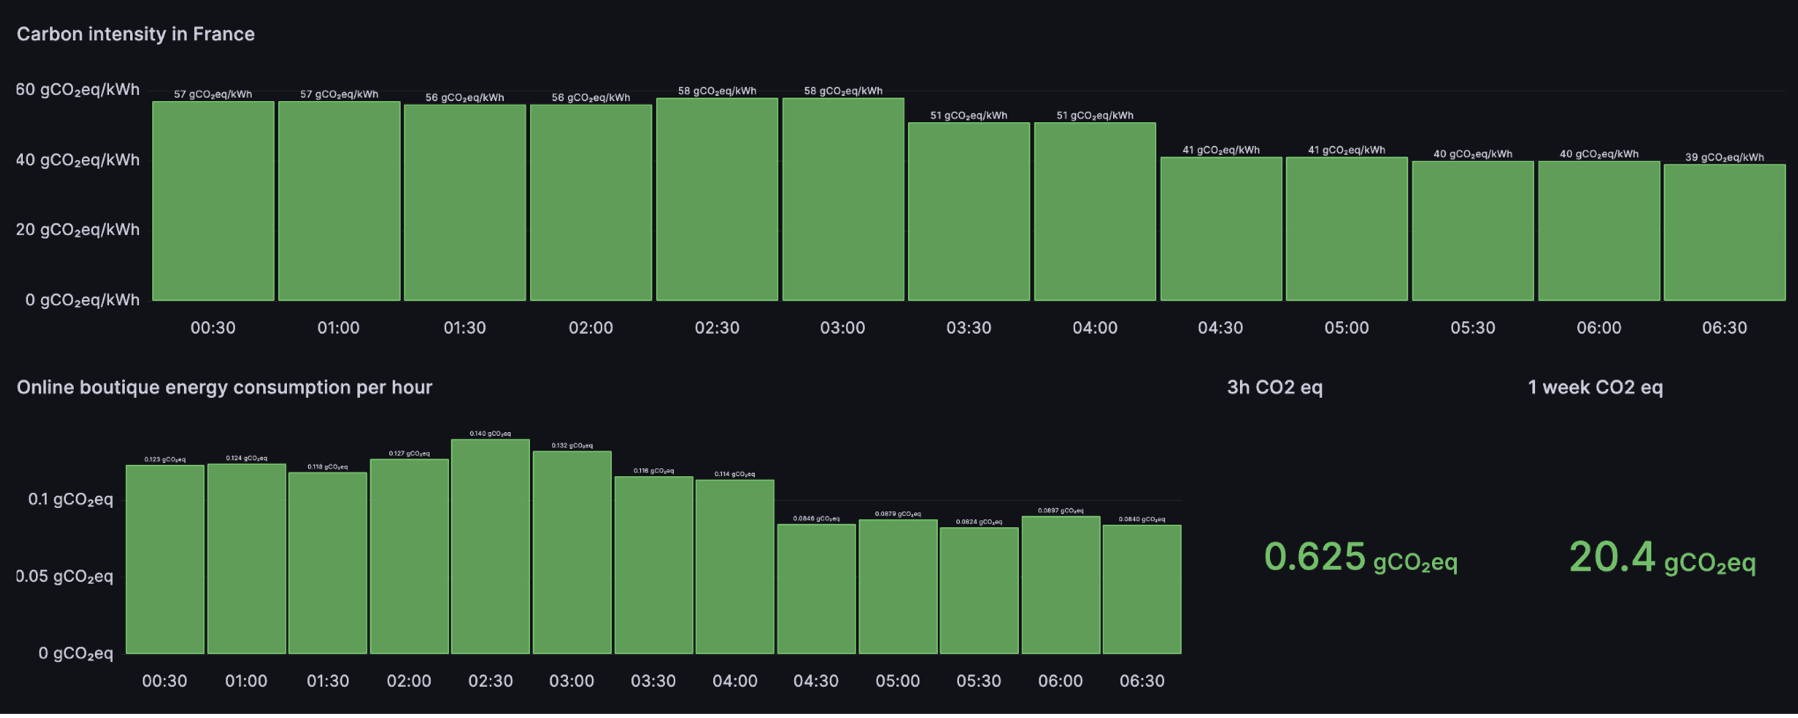
1st line: Carbon intensity retrieved from ElectricityMaps
2nd line: CO₂ equivalent emissions of the onlineboutique application over different time intervals
To raise awareness, we could continue with equivalences like hours of a light bulb or kilometers traveled by cars.
Measuring application energy consumption is complex, and while our metrics are satisfactory, they are still limited in certain aspects.
Regarding the metrics exposed by Scaphandre, it relies on metric files that provide measurements from the RAPL (Running Average Power Limit) sensor. While RAPL is commonly used, it has limitations, as explained in this Boavizta article (in French) comparing chassis-level measurements to RAPL sensor measurements at the system level. The main limitation is that RAPL only accounts for CPU consumption most of the time and thus omits the consumption of other components such as SSDs, GPUs, etc.
About our consideration of PUE: PUE (Power Usage Effectiveness) is a measure at the data center level and may not necessarily represent the ratio between the total power consumed and that actually consumed by the CPU of our server.
While acknowledging these limitations, we consider the existing metrics valuable for monitoring application energy consumption and guide decisions.
After experimenting with Scaphandre, we find that this project responds well to the initial promise, namely measuring the energy consumption of applications on Kubernetes. We have tried to show through our different visualizations that its use makes it possible to integrate the notion of energy consumption, both to raise awareness, but also to guide decision-making aimed at reducing this consumption.
As of now, Scaphandre comes with significant constraints to operate, notably the access to the RAPL sensor. Since RAPL is not, by default, propagated from a hypervisor to virtual machines; instances on cloud providers cannot use the metrics. We can only hope that collaborative efforts between cloud providers and the Scaphandre project will enable access to metrics from virtualized instances in the future. To see this happen quickly for Scaleway you can upvote this feature request.
Scaphandre is an open-source project that serves energy transparency through observability. The project welcomes contributors in various forms; refer to the available contribution guide and don't underestimate your impact 🙂
This is a guest post by WeScale's Rémi Calizzano (Cloud Native Developer) and Damien Vergnaud (Cloud Builder). Thanks guys!

You can't improve what you can't measure. The good news: you can, when it comes to cloud, hardware, software and website energy consumption. Let's go!

How a French startup reinvented the milkman... with help from Kubernetes!