How to send metrics from your Kubernetes cluster to your Cockpit
On this page, we will show you how to send application metrics from your Kubernetes cluster to your Cockpit, either by using a Helm chart or deploying a Helm chart with Terraform or OpenTofu.
We will use the k8s-monitoring Helm Chart, which installs an Alloy Daemon set to export your Kubernetes cluster's metrics to your Cockpit.
Before you start
To complete the actions presented below, you must have:
- A Scaleway account metricsged into the console
- Owner status or IAM permissions allowing you to perform actions in the intended Organization
- Created a custom external data source of the metrics type
- Created a Cockpit token in the same region as the metrics data source
- A running Kubernetes cluster containing your deployed application
- Created an API key and retrieved your API secret key
Configure the Helm chart
Create a values.yml file to configure your Helm chart, using the example below. Make sure that you replace $SCW_CLUSTER_NAME with the name of your Scaleway Kubernetes cluster, $COCKPIT_CUSTOM_METRICS_DATASOURCE_URL with the URL of your custom metrics data source (you can find it under the "API URL" section in the Data sources tab of the Scaleway console), and $COCKPIT_TOKEN with your Cockpit token.
cluster:
  name: "$SCW_CLUSTER_NAME"
global:
  scrape_interval: 60s
destinations:
  - name: "my-cockpit-metrics"
    type: "prometheus"
    protocol: "http"
    metrics:
      enabled: true
    url: "$COCKPIT_CUSTOM_METRICS_DATASOURCE_URL/api/v1/push"
    tenantId: "$COCKPIT_TOKEN"

    logs:
      enabled: false
    traces:
      enabled: false

annotationAutodiscovery:
  enabled: true
  destinations: ["my-cockpit-metrics"]

alloy-metrics:
  enabled: true
alloy-singleton:
enabled: trueAdd annotations for auto-discovery
Annotations in Kubernetes provide a way to attach metadata to your resources. For k8s-monitoring, these annotations signal which Pods should be scraped for metrics, and what port to use. These annotations have to be on the Pods that the deployment will spawn so they have to be in the Pod template, not the deployment itself.
In this documentation we are adding annotations to specify we want k8s-monitoring to scrape the Pods from our deployment. Make sure that you replace $METRICS_PORT with the port where your application exposes Prometheus metrics.
Kubernetes deployment template
apiVersion: apps/v1
kind: Deployment
spec:
  template:
    metadata:
      annotations:
        "k8s.grafana.com/metrics.portNumber" = "$METRICS_PORT"
        "k8s.grafana.com/scrape" = "true"
Terraform/OpenTofu deployment template
resource "kubernetes_deployment_v1" "your_application_deployment" {
  ...
  spec {
    ...
    template {
      metadata {
        ...
        annotations = {
          "k8s.grafana.com/metrics.portNumber" = "$METRICS_PORT"
          "k8s.grafana.com/scrape" = "true"
        }
      }
      ...
    }
  }
}
Send Kubernetes metrics using Helm chart with Terraform/OpenTofu
- Create a
provider.tffile and paste the following template to set up the Helm Terraform/OpenTofu provider:provider "helm" { kubernetes { host = your_k8s_cluster_host # The URL of your Kubernetes API server. token = your_k8s_cluster_token # Authentication token to access the cluster. cluster_ca_certificate = base64decode( your_k8s_cluster_ca_certificate # The cluster's CA certificate. ) } } - Create a
maint.tffile and paste the following template to create a Helm release resource. Make sure that you replace/your-path/to/values.ymlwith the actual path to your values file.resource "helm_release" "alloy" { name = "name-of-your-metrics-ingester" repository = "https://grafana.github.io/helm-charts" chart = "k8s-monitoring" version = "2.0.2" namespace = "metrics-ingester" create_namespace = true values = [file("/your-path/to/values.yml")] } - Save your changes.
- Run
terraform initto initialize your Terraform/OpenTofu configuration and download any necessary providers. - Run
terraform applyto apply your configuration. - Type
yeswhen prompted to confirm the actions.
Send Kubernetes metrics using Helm chart
Once you have configured your values.yml file, you can use Helm to deploy the metric-forwarding configuration to your Kubernetes cluster. Before installing the Helm chart, ensure that your kubectl tool is properly connected to your Kubernetes cluster. kubectl is the command-line tool for interacting with Kubernetes clusters.
-
Connect
kubectlto your Kubernetes cluster -
Run the command below to install the
k8s-monitoringHelm chart. Make sure that you replace/your-path/to/values.ymlwith the correct path where yourvalues.ymlfile is stored. Make sure that you also replacename-of-your-choice-for-your-metric-ingesterwith a clear name (ex.alloy-metrics-ingester).helm repo add grafana https://grafana.github.io/helm-charts helm repo update helm install -f /your-path/to/values.yml name-of-your-choice-for-your-metric-ingester grafana/k8s-monitoring --version 2.0.21 -
Optionally, check the status of the release to ensure it was installed:
helm list
Explore your metrics in Cockpit
Now that your metrics are exported to your Cockpit, you can access and query them.
- Click Cockpit in the Monitoring section of the Scaleway console side menu. The Cockpit Overview page displays.
- Click Open dashboards to open your preconfigured dashboards in Grafana. You are redirected to the Grafana website.
- Log in to your Grafana account.
- Click the Grafana icon in the top left side of your screen to open the menu, then click Explore.
- Select your custom data source in the search drop-down on the upper left corner of your screen.
- In the Labels filter drop-down, select the
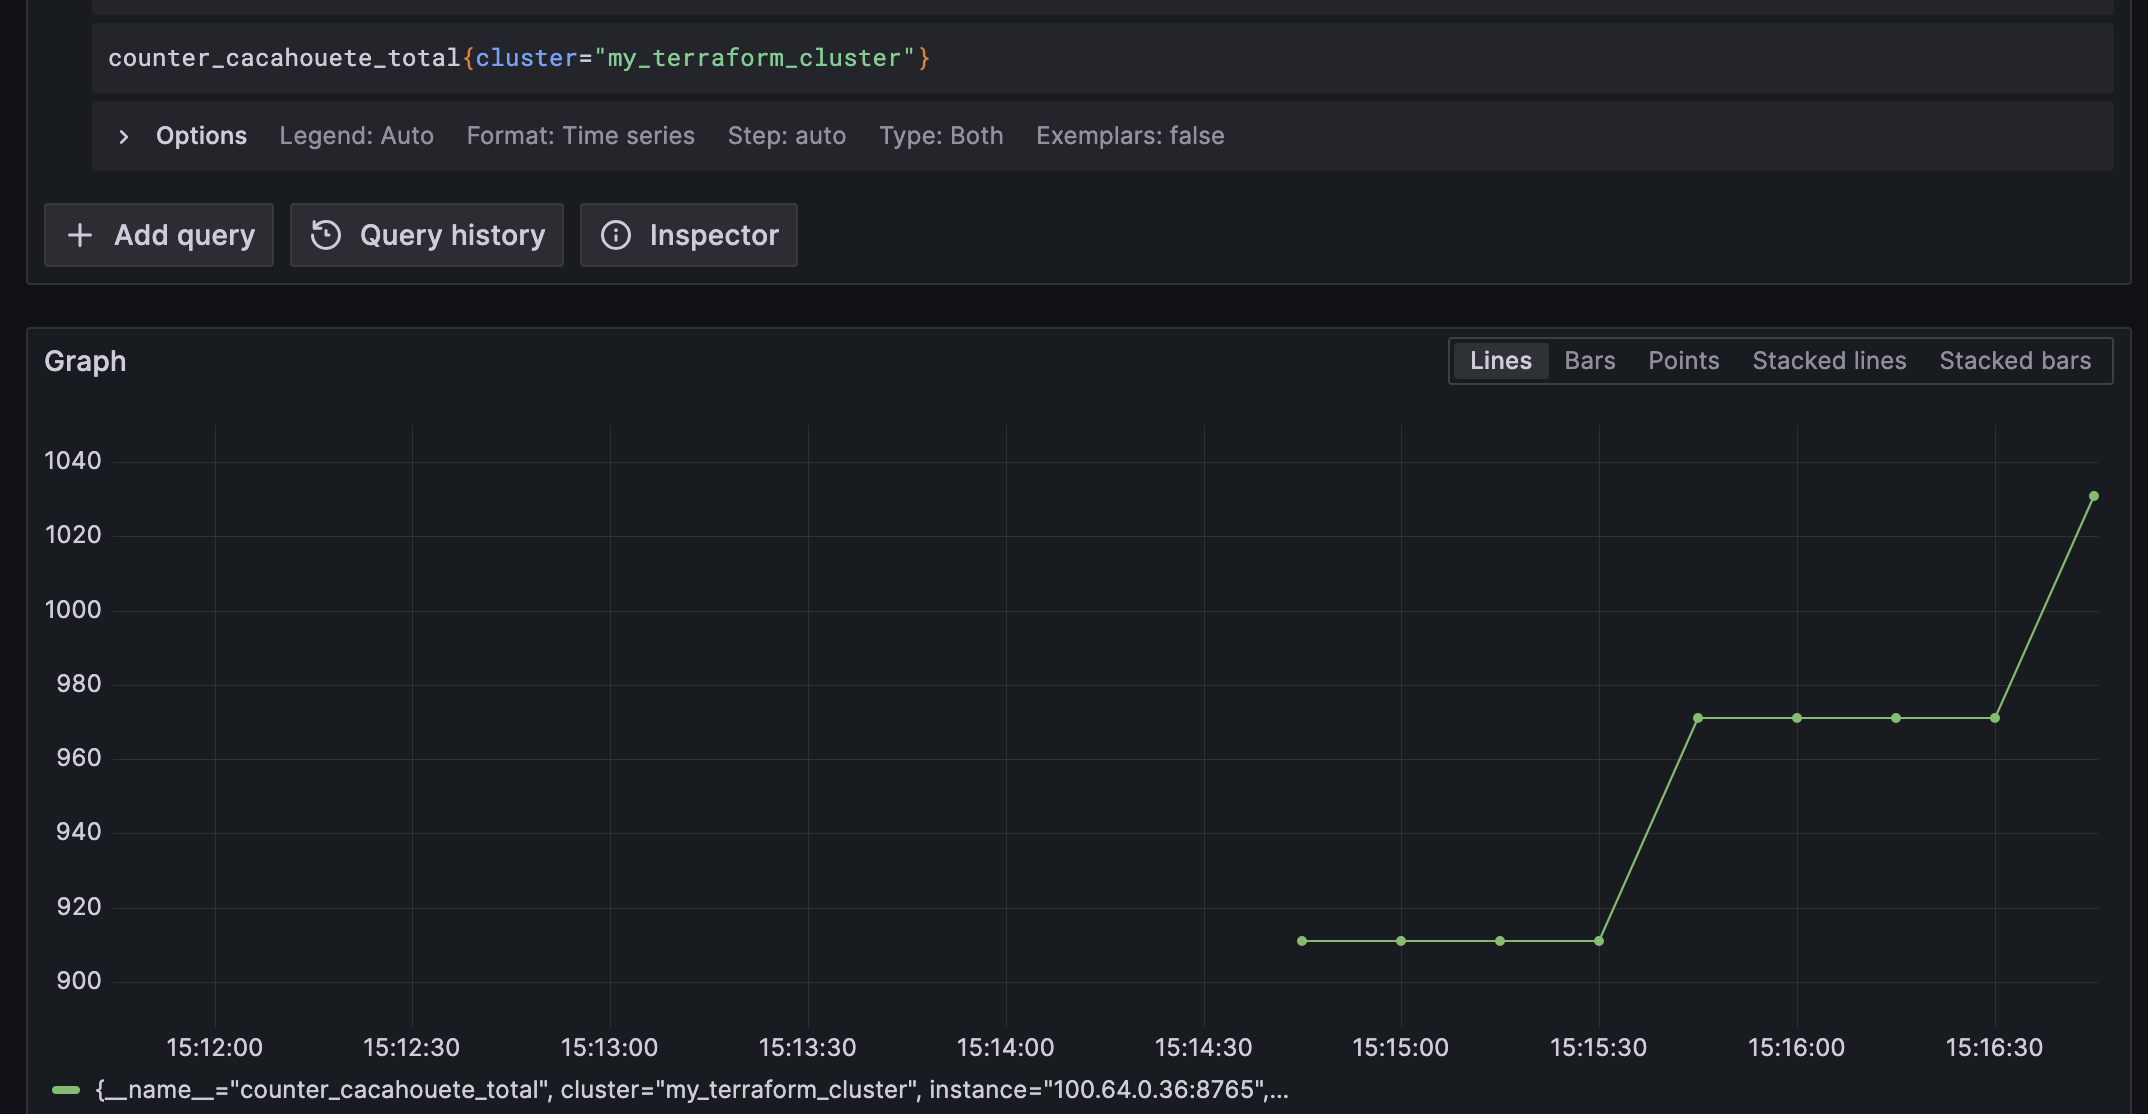
clusterlabel and in the Value drop-down, select your cluster. - Optionally, click the Clock icon on the top right corner of your screen and filter by time range.
- Click Run query to see your metrics. An output similar to the following should display.