No data showing up on Grafana dashboards
This page shows you how to visualize your data again when it does not display on your Grafana dashboards, using the SyncGrafanaDataSources endpoint of the Cockpit Global API or the Scaleway CLI.
Before you start
To complete the actions presented below, you must have:
- A Scaleway account logged into the console
- Created an API key with sufficient IAM permissions to perform the actions described on this page
- Installed curl
- Configured your environment variables
Problem
-
Many Cockpit users often encounter issues with Grafana data sources not synchronizing properly, leading to missing data on dashboards when data should be available.
When users open their Grafana dashboards, they see a
No datamessage along with an error banner stating:Failed to upgrade legacy queries datasource was not found.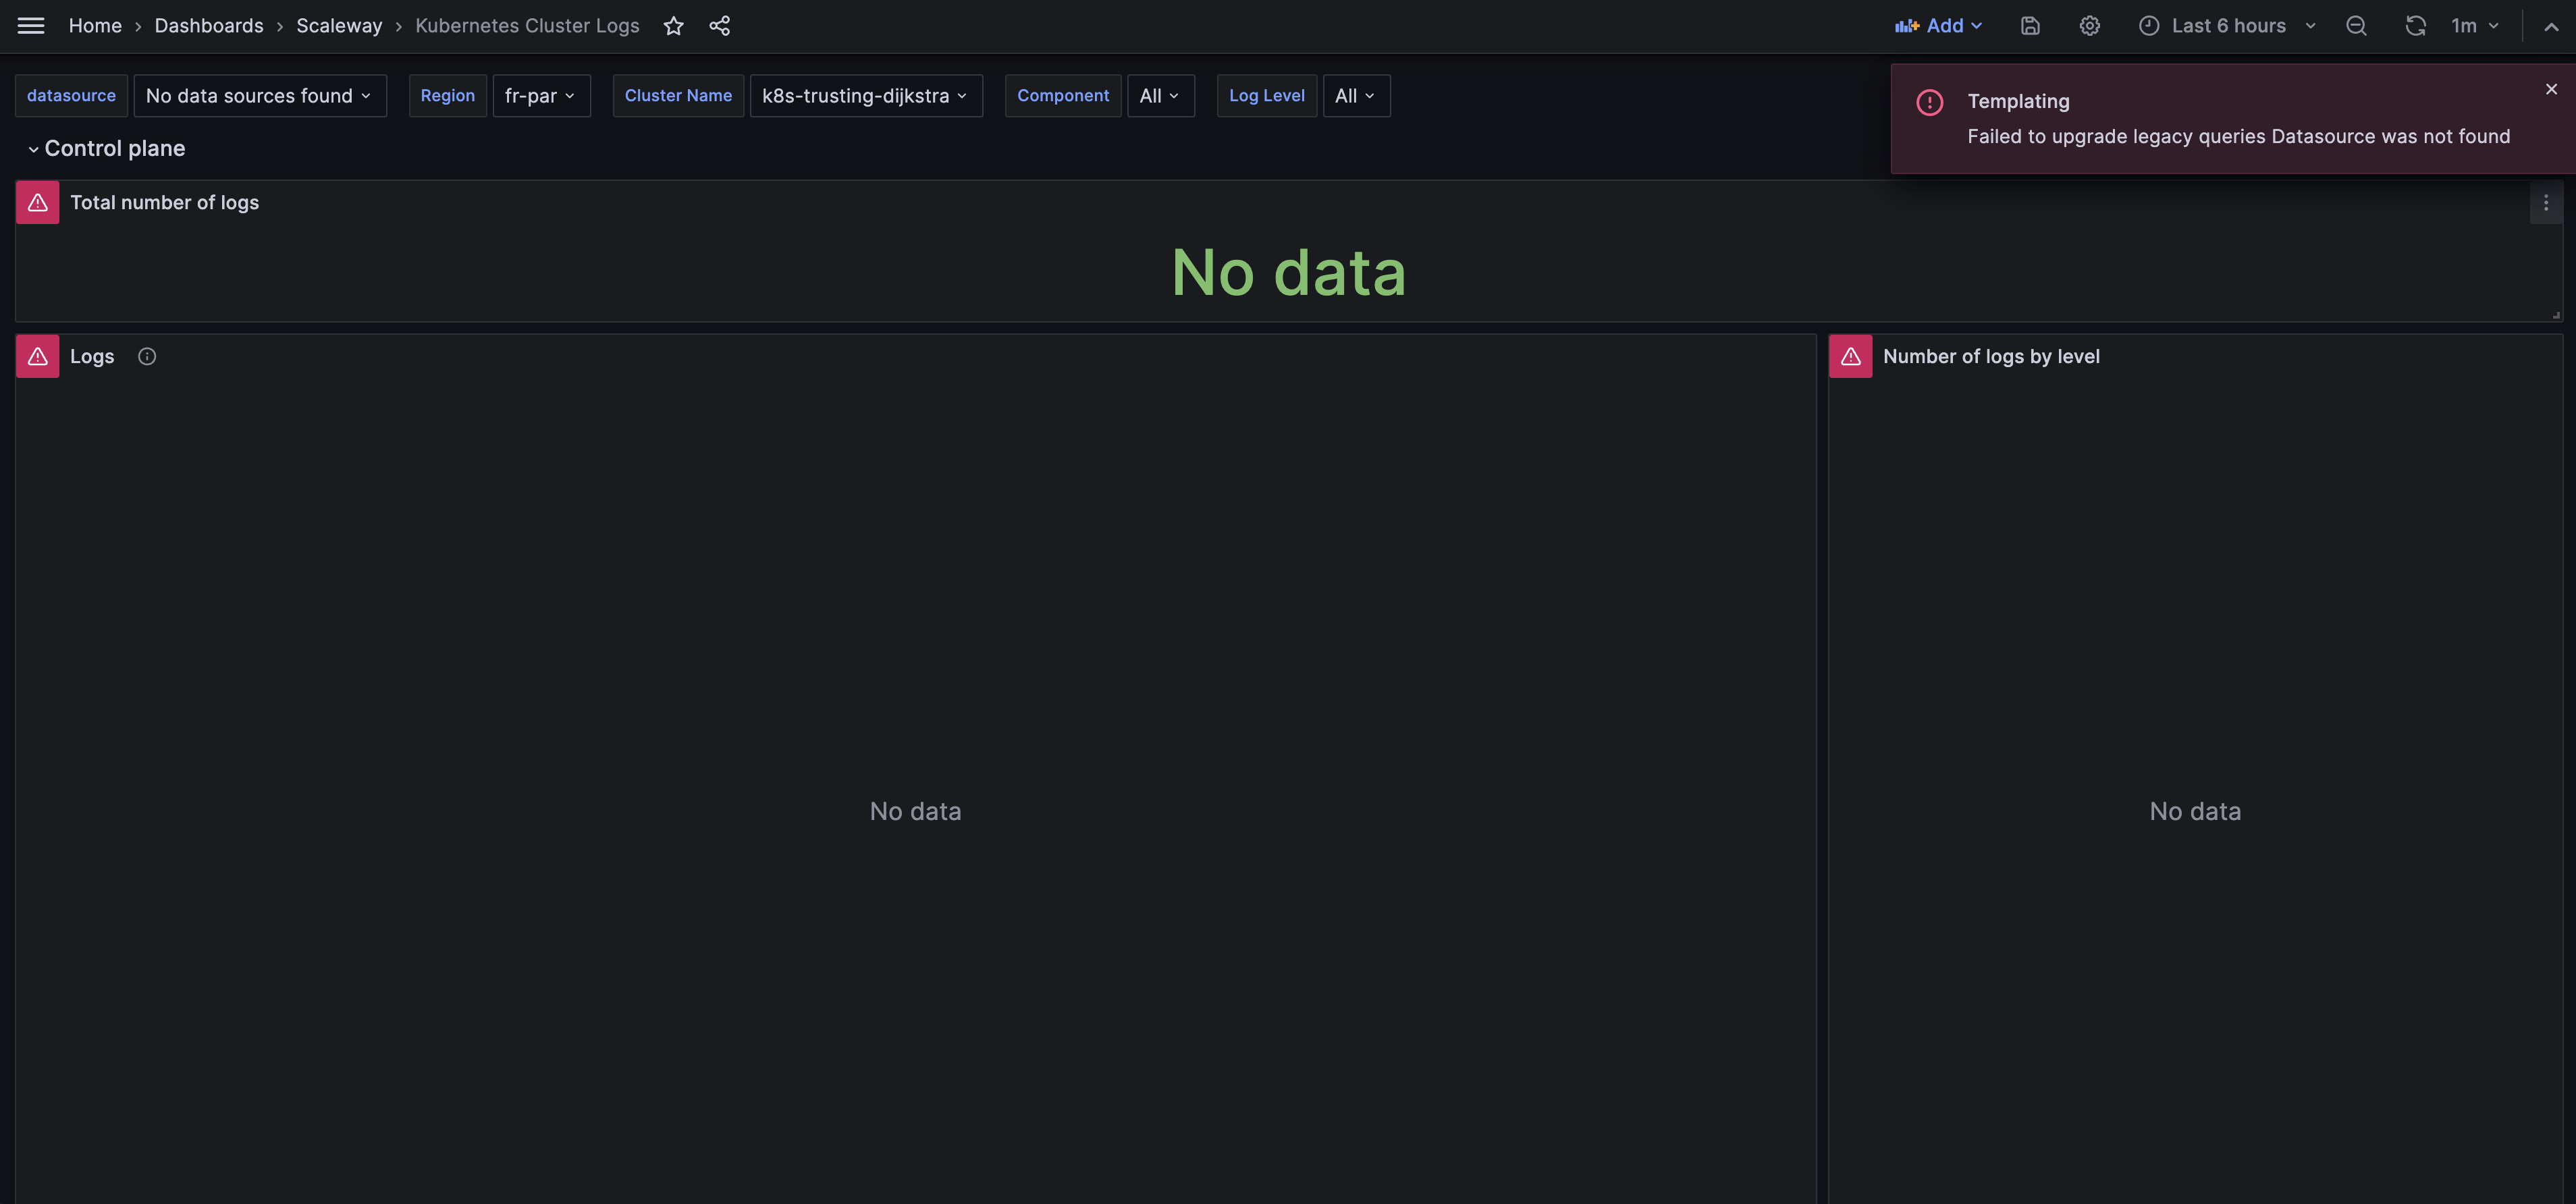
-
Your Cockpit is unavailable.
-
You cannot view your logs and/or metrics in Grafana.
-
Your Cockpit data sources are not configured.
-
You cannot view your dashboards in Grafana.
Cause
These issues often occur due to synchronization failures between Cockpit and Grafana, preventing dashboards from displaying the latest logs and metrics as expected.
Solution
Using the Scaleway API
Open a terminal and run the following command to trigger the synchronization of your data sources:
curl -X POST \
-H "X-Auth-Token: $SCW_SECRET_KEY" \
-H "Content-Type: application/json" \
-d '{"project_id":"$SCALEWAY_PROJECT_ID"}' \
"https://api.scaleway.com/cockpit/v1/grafana/sync-data-sources"
Make sure that you replace $SCW_SECRET_KEY with your API secret key and $SCALEWAY_PROJECT_ID with the ID of the Scaleway Project affected by the issue.
Using the Scaleway CLI
Open a terminal and run the following command:
scw cockpit grafana sync-data-sources project-id=<PROJECT-ID>Make sure that you replace <PROJECT-ID> with the ID of the Scaleway Project affected by the issue.