How to monitor Edge Services with Scaleway Cockpit
You can view your Edge Services metrics and logs via Scaleway Cockpit. This allows you to monitor your ingress, egress, request rate, and cache hit ratio as well as other metrics and logs, in convenient managed Grafana dashboards.
Metrics
How to access the metrics dashboard
Access your Edge Services metrics dashboard by following the instructions for accessing a preconfigured Grafana dashboard via Cockpit, and selecting the Edge Services Overview dashboard from the list of Scaleway dashboards.
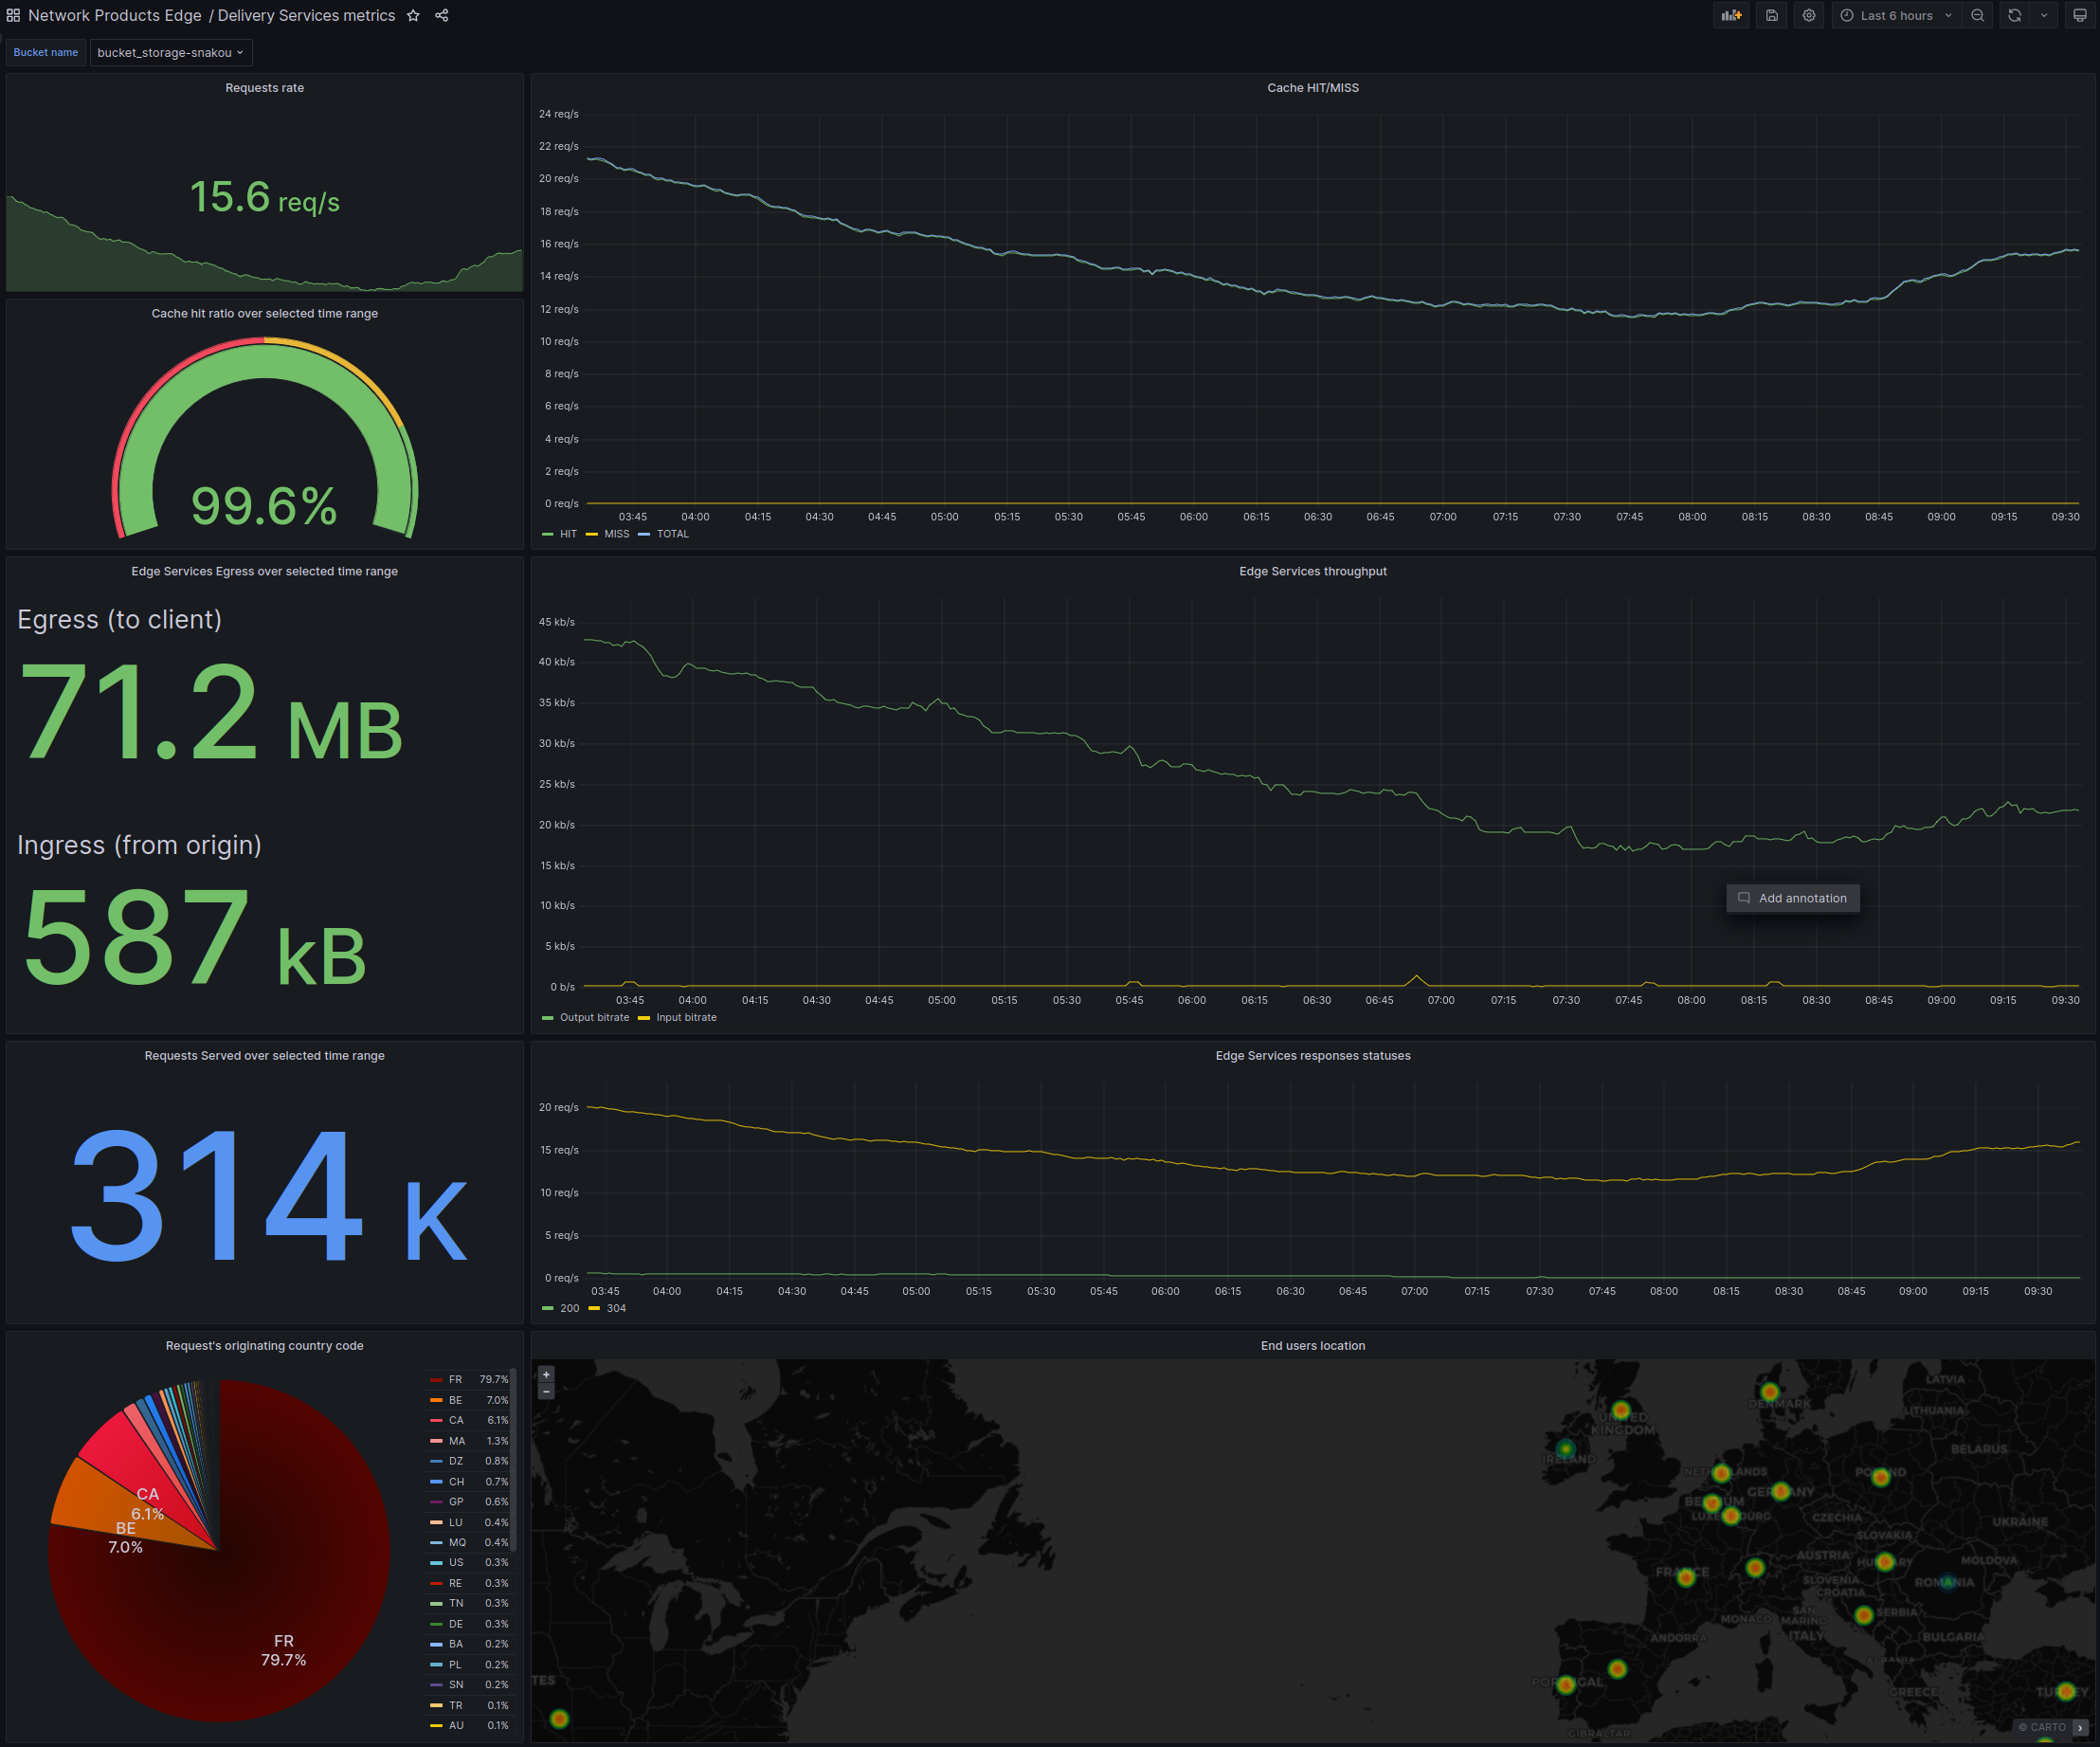
Understanding the metrics dashboard
The Grafana dashboard presents a number of different metrics. Use the drop-down in the top left to select which pipeline and backend to view Edge Services metrics for, and the time range drop-down in the top right to modify the time period to apply to the metrics.
The screenshot below shows an example of Edge Services metrics for a given pipeline:
-
Request rate: The number of requests made to Edge Services per second, for the specified backend, averaged over the specified time period.
-
Cache hit ratio: The percentage of requests served from Edge Services' cache, compared to the total number of requests to reach Edge Services for this backend, over the specified time period.
-
Cache HIT/MISS: A visual representation of the ratio of cache hits to misses, for the specified backend, over the specified time period.
- Cache hit line: The number of requests per second made to Edge Services for this backend, which were served directly from its cache.
- Cache miss line: The number of requests per second made to Edge Services for this backend, where the content was fetched from the backend rather than the cache.
- Total line: The number of requests per second made to Edge Services for this backend.
-
Egress (to client): The total volume of data served to clients from Edge Services, for the specified backend, over the specified time period.
-
Ingress (from backend): The total volume of data from the backend server to Edge Services over the specified time period. This represents the traffic that occurs when Edge Services retrieves content from the backend server in order to fulfill requests.
-
Edge Services throughput: A visual representation of the rate of data transfer for the specified backend with Edge Services, over the specified time period.
- Output bitrate line: The rate at which data is being delivered from Edge Services to end users.
- Input bitrate line: The rate at which Edge Services is fetching data from the backend server. Peaks in this line may represent times when Edge Services had to fetch content from the backend server, rather than being able to serve it directly from its own cache.
-
Requests served: The total number of requests that Edge Services has successfully served, for the specified backend, over the specified time period.
-
Edge Services response statuses: A visual representation of the distribution of HTTP response statuses for requests served by Edge Services over the specified time period. Consult the full list of HTTP status codes for more information if necessary.
-
Request backend country: The proportion of requests (to Edge Services for the specified backend, over the specified time period) originating from different countries.
-
End users location: A visual representation of where Edge Services end users have been making requests from geographically.
-
Total WAF processed requests: The total number of requests evaluated by WAF.
-
Detailed WAF processed requests: A visual representation of the requests evaluated by WAF over time, distributed in WAF actions.
Logs
How to access the logs dashboard
Access your Edge Services logs dashboard by following the instructions for accessing a preconfigured Grafana dashboard via Cockpit, and selecting the Edge Services Logs dashboard from the list of Scaleway dashboards.
Understanding the logs dashboard
The Grafana dashboard presents a centralized and detailed view of HTTP requests handled by a given Edge Services pipeline. It captures and displays logs for each requests/response. Use the drop-down in the top left of the screen to select which pipeline's logs to view, and to define the log level. In the top right, use the time range drop-down in the top right to modify the time period to apply.
The screenshot below shows an example of Edge Services logs for a given pipeline:
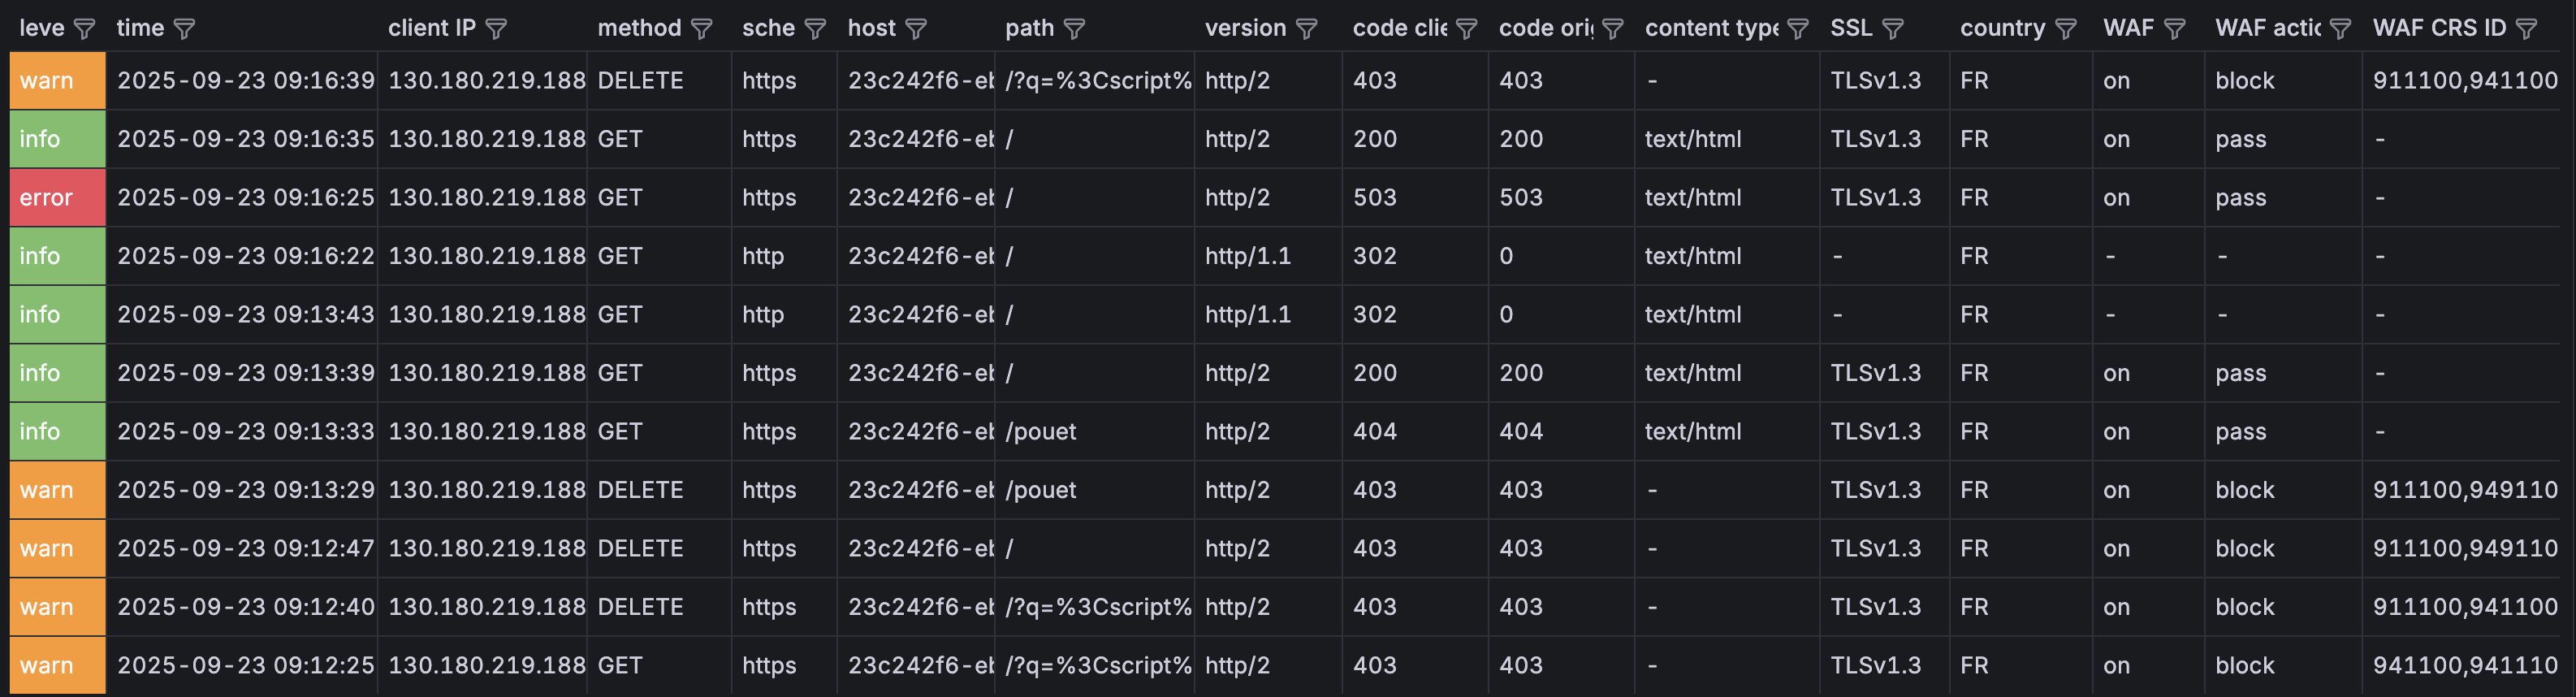
- Level: Severity of the log entry, either
error,warn, orinfo. - Time: Date and time of the logged event.
- Client IP: IP address of the client (user or system) that initiated the request.
- Method: HTTP method used in the request, e.g.
GET,POST,PUTetc. - Schema: Specifies whether the request was made over HTTP or HTTPS.
- Host: Server that received the request.
- Path: Specific resource path that the client is requesting.
- Version: HTTP protocol version used in the request, e.g.
HTTP/2. - Code Client HTTP status code returned to the client, e.g.
503,200,403. - Code backend: HTTP status code generated by the backend/backend server that processed the request.
- Content type: Type of content returned in the response, e.g.
text/html,application/json. - SSL: Whether the client request was encrypted with SSL/TLS, and which version e.g.
TLSv1.3. - Country: Country from which the request originated.
- WAF: The Web Application Firewall mode. Either
on,off, orlog_only. - WAF action: Action taken by WAF, either
blockorpass. - WAF CRS ID: WAF CRS rules, if any, that were actioned on the request.