How to use the Environmental Footprint dashboard
The Scaleway Environmental Footprint dashboard helps you monitor and analyze the environmental impact of your cloud resource usage. It provides clear visibility into carbon and water consumption, enabling accurate reporting and informed optimization decisions.
Before you start
To complete the actions presented below, you must have:
- A Scaleway account logged into the console
- Owner status or IAM permissions allowing actions in the target Organization
- Environmental data is available only for clients using supported Scaleway products. Data is generated daily and becomes visible the day after product activation.
Access the dashboards
-
In the Scaleway console, click Environmental Footprint under Cost & Impact Management.
-
An overview of your Organization’s environmental footprint for the previous and current month is displayed (carbon/water). The chart shows consumption by product category. Click Water to switch to water consumption.
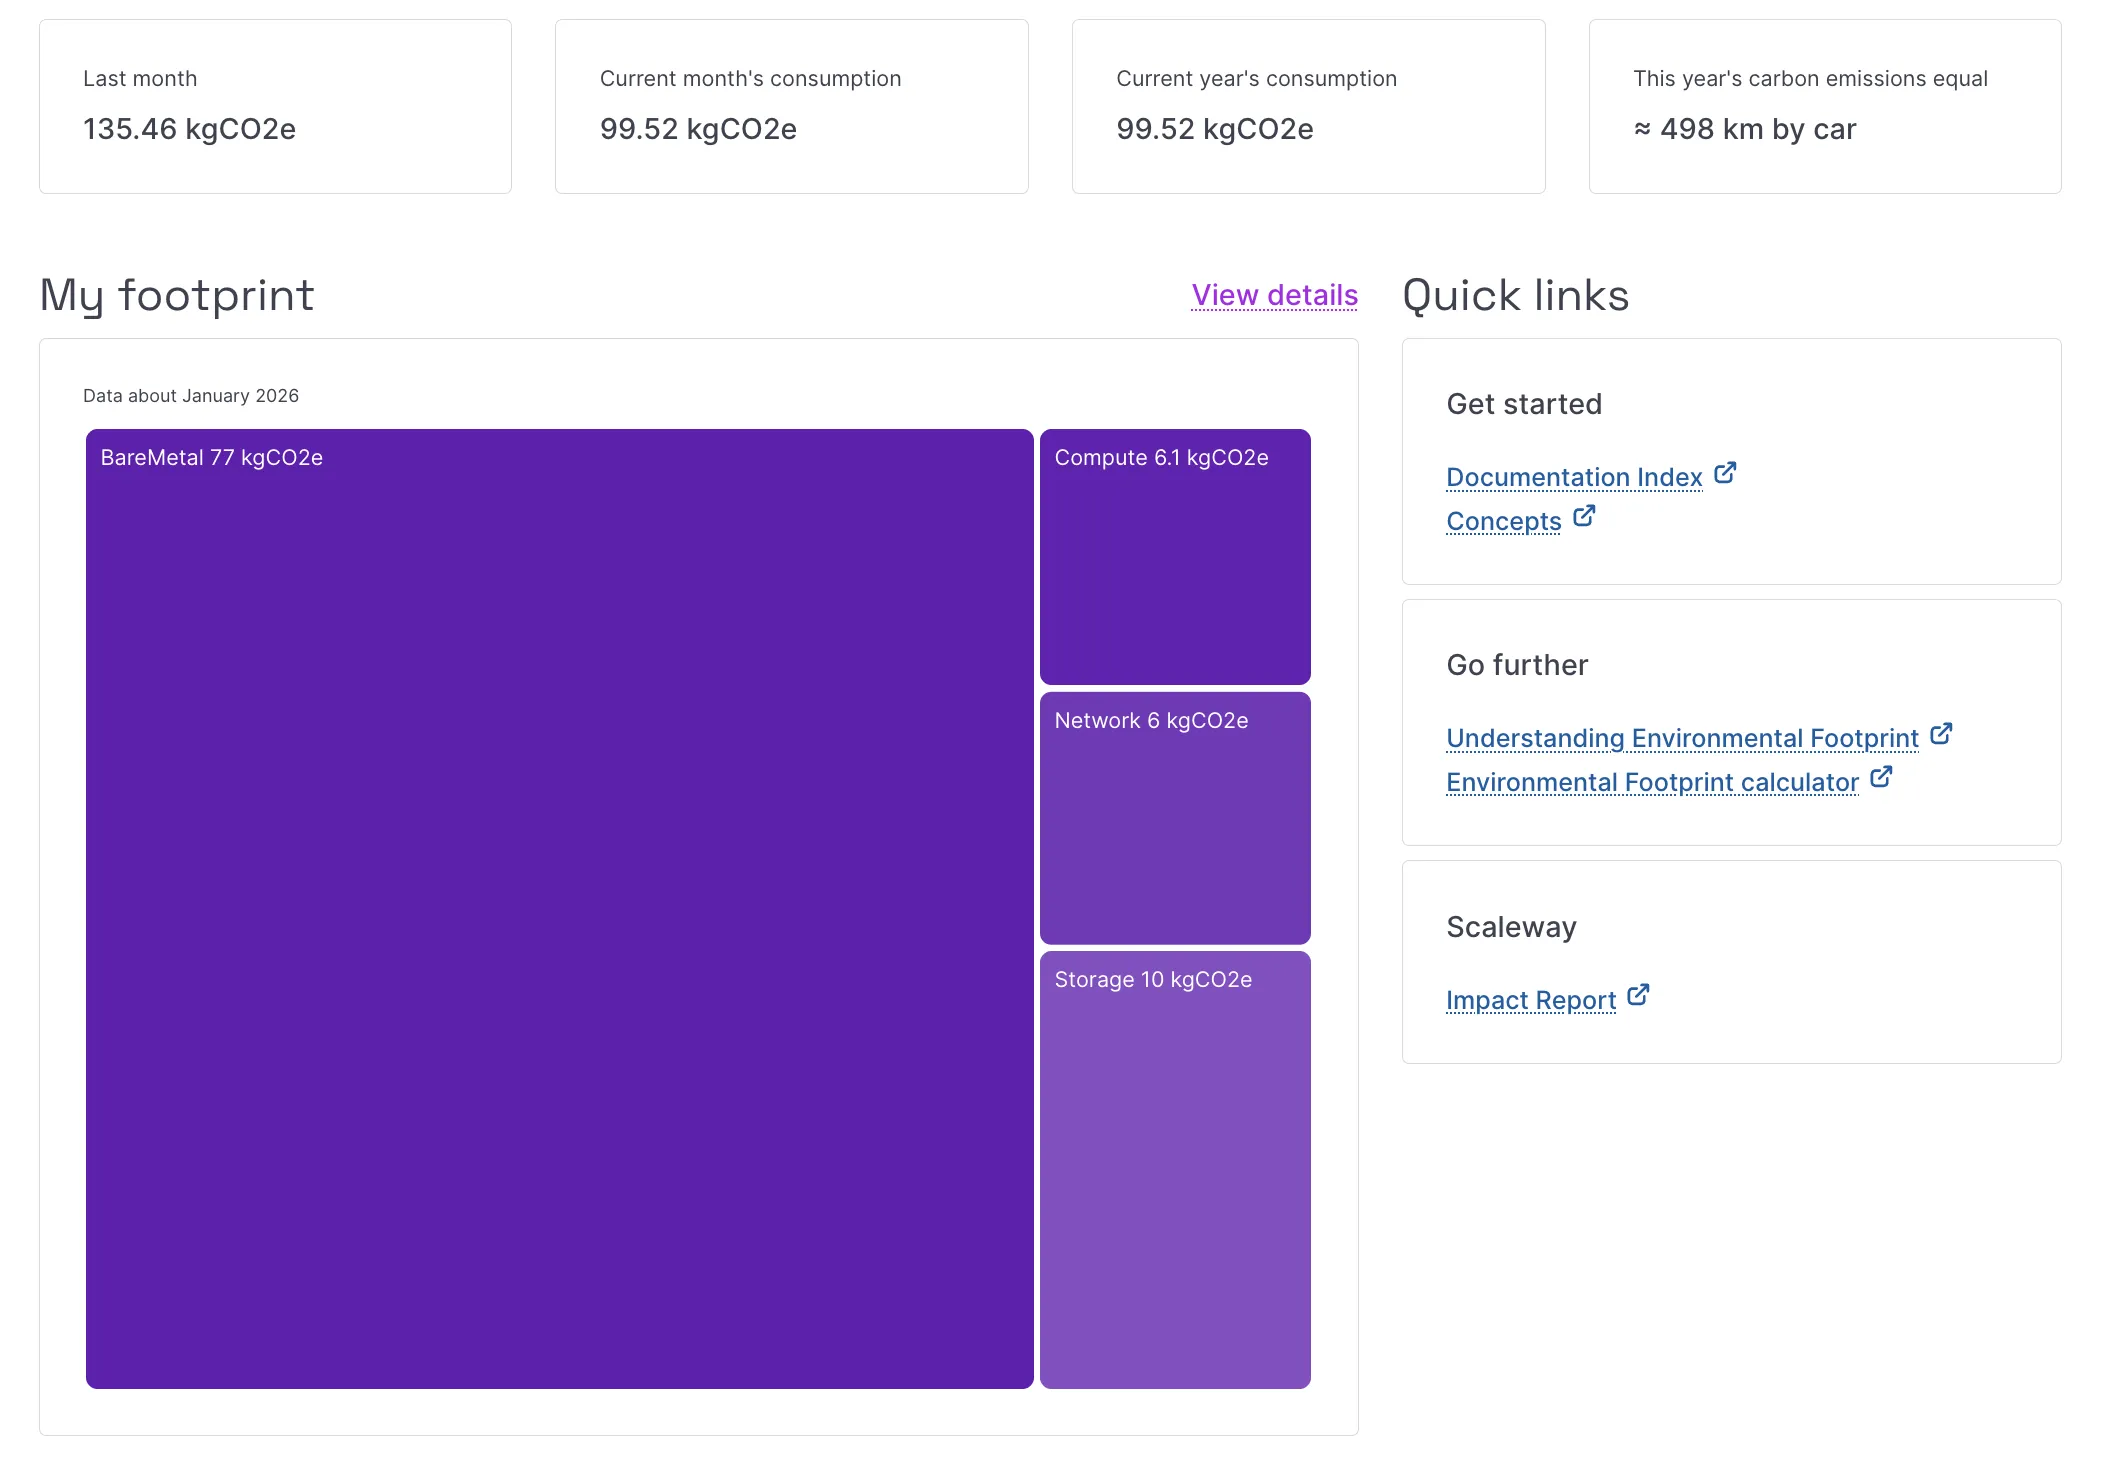
Click View details to open the detailed dashboard.
-
The detailed dashboard opens with carbon consumption data.
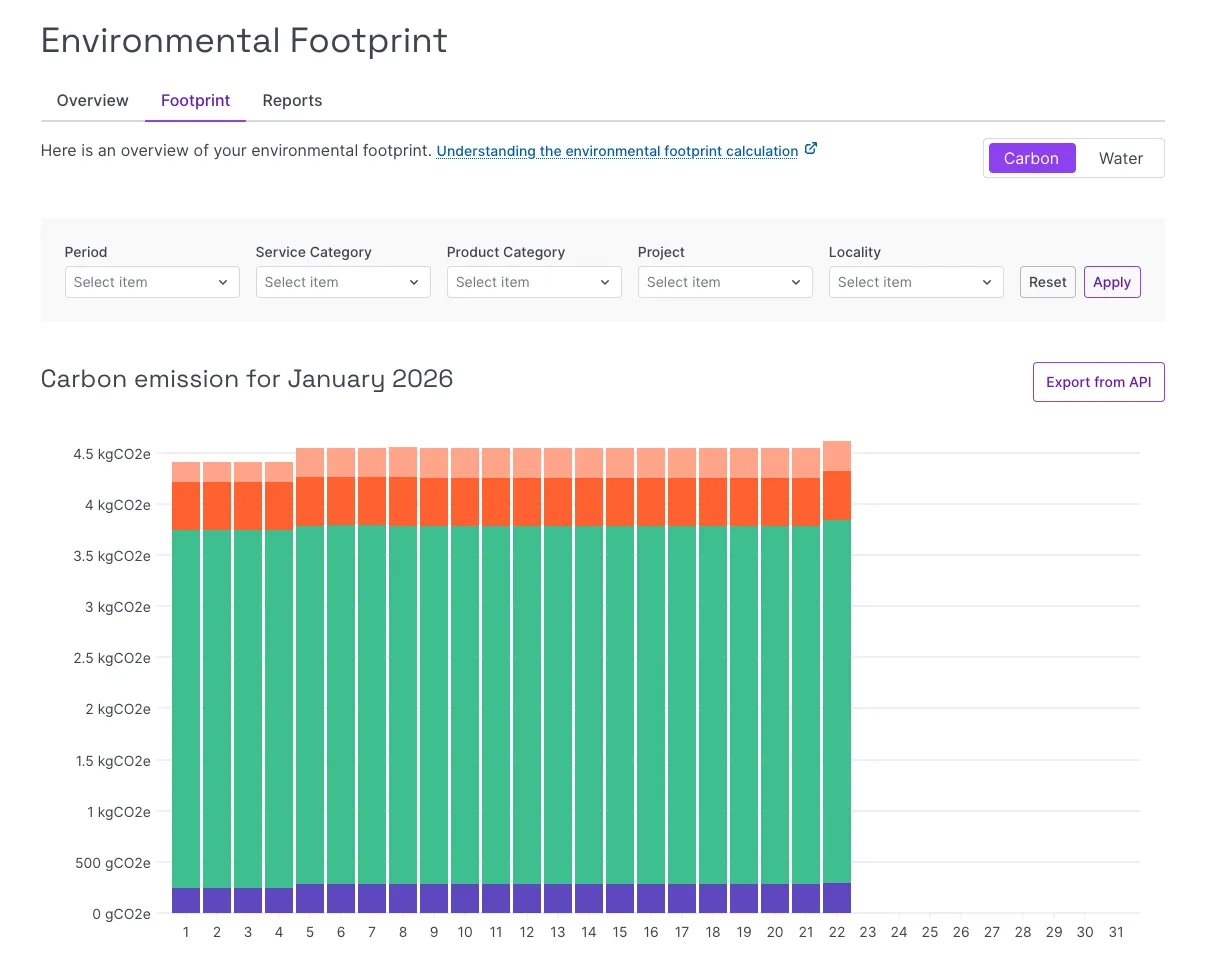
Filter consumption data
Use the filters, then click Apply.
Available filters:
- Period – Filter data by month. When a single month is selected, the dashboard displays daily data. When multiple months are selected, the dashboard displays monthly data.
- Service Category – The type of service (for example, Compute or Storage).
- Product Category – Specific product type. Values represent the total consumption of all matching products.
- Project – One or more Projects in the Organization. Leave empty to include all Projects.
- Locality – Regions or Zone where resources are deployed. Leave empty to include all regions.
Deleted Projects appear as Deleted.
Click Reset to clear all filters.
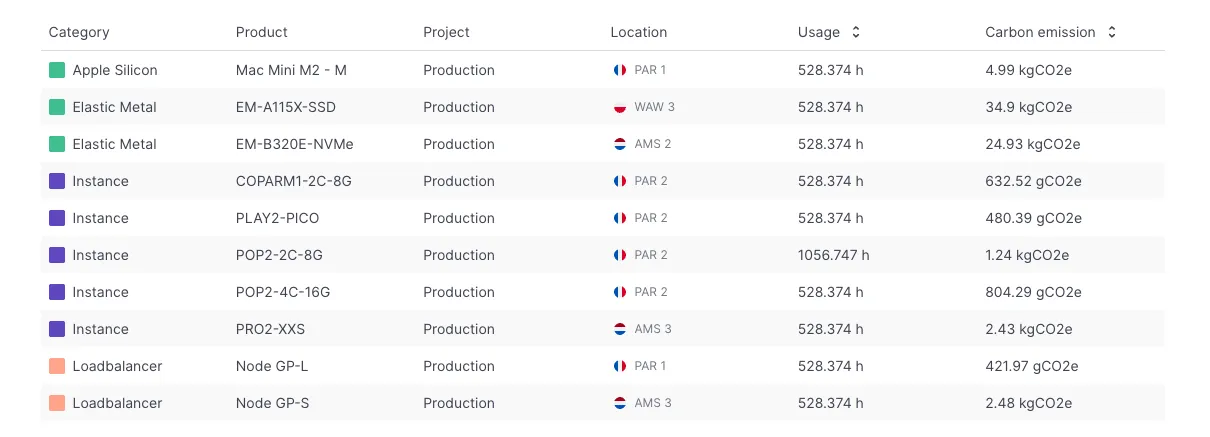
View detailed consumption
Scroll down to view the detailed consumption list based on your filters.