How to monitor your Load Balancer with Scaleway Cockpit
You can view your Load Balancer's metrics and logs by using Scaleway Cockpit. Load Balancer is fully integrated into Cockpit, and allows you to monitor your Load Balancers frontends, backends, and backend servers at a glance, and visualize your metrics, traffic and logs. This page explains how to get started with Scaleway Cockpit for viewing your Load Balancers metrics and logs.
Before you start
To complete the actions presented below, you must have:
- A Scaleway account logged into the console
- Owner status or IAM permissions allowing you to perform actions in the intended Organization
- Created a Load Balancer
How to access the Grafana dashboard
To view your Load Balancer's metrics and logs via Cockpit, use the Grafana dashboard which is accessible from the Scaleway console:
- First, you must create a user and their associated credentials (a username and password) for Grafana
- Then, you can use these credentials to access the Grafana dashboard for all your Scaleway products, via the Scaleway console.
-
Create a Grafana user and retrieve their username and password by following this procedure.
-
From the Scaleway console Cockpit overview page, click Open dashboards in the top right corner.
-
Enter your Grafana username and password to log in.
You are directed to the Scaleway Cockpit dashboards homepage.
How to view and understand your Load Balancer metrics
From the Scaleway Cockpit dashboards homepage, click Dashboards in the side menu, and select LB Overview.
You are directed to the Load Balancer Overview dashboard.
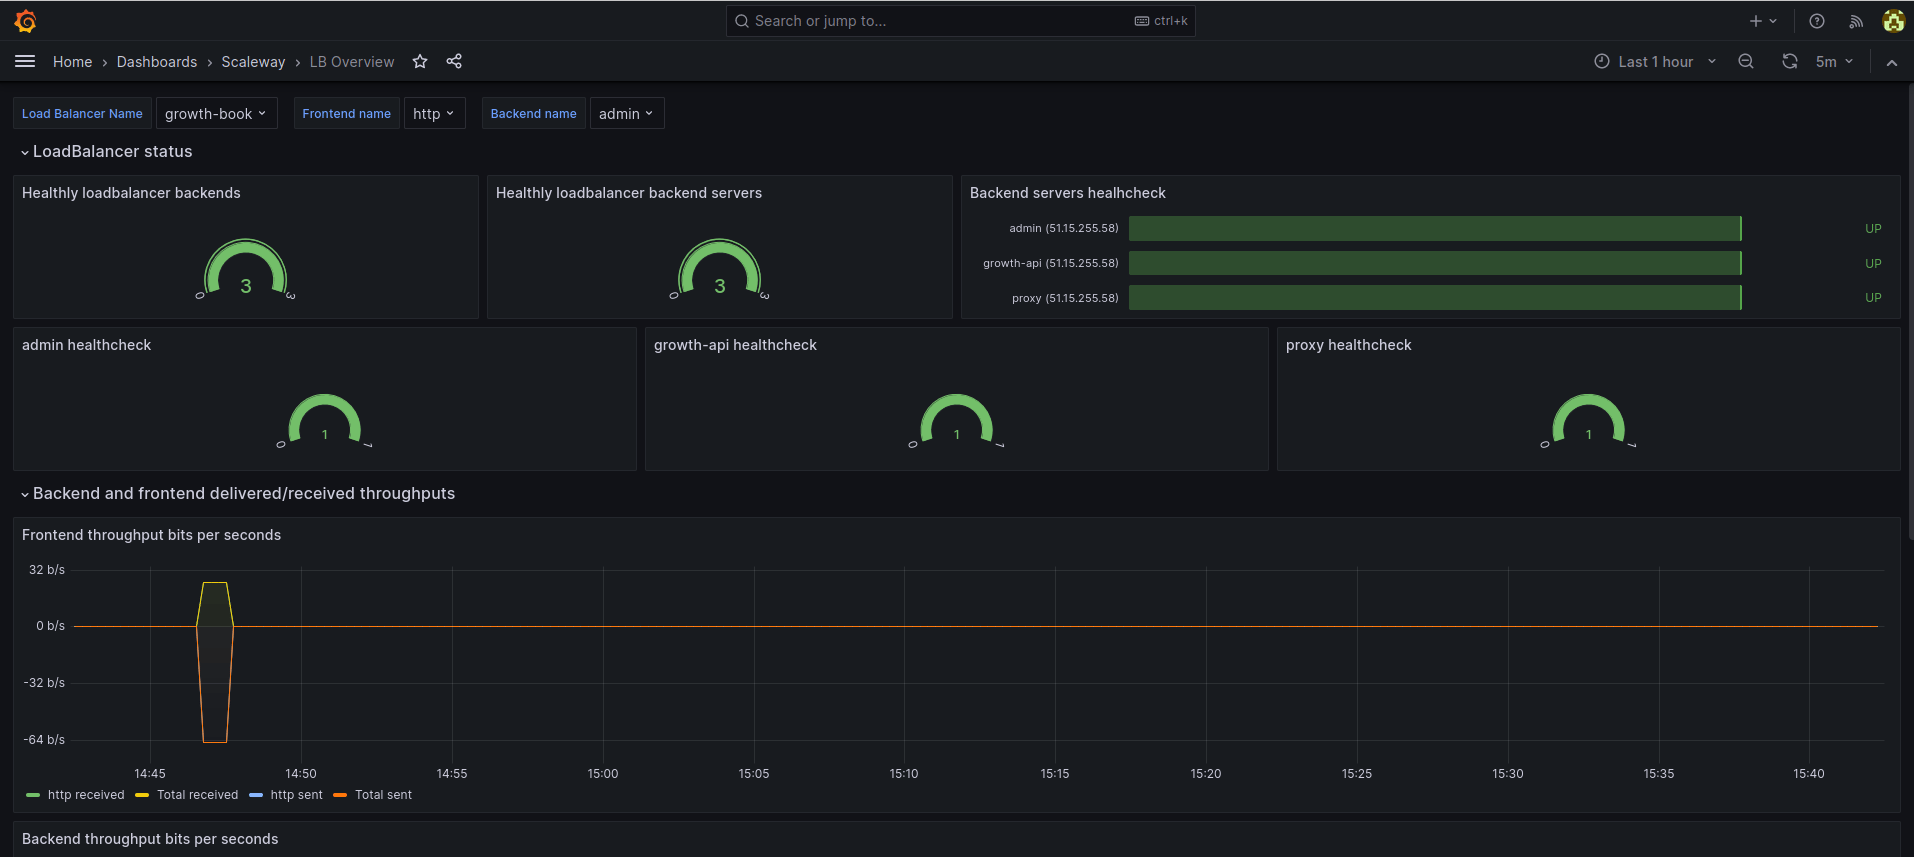
Choosing metric parameters
At the top of the dashboard, you can configure the following parameters, which control which metrics are displayed:
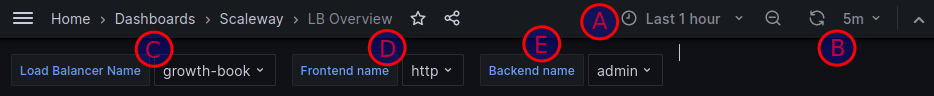
- A: Time period: Click this drop-down to configure the time period you want the metrics displayed to cover. You can set an absolute time range, from one fixed date-time to another, or use a quick range such as
Last 15 minutesorLast 3 hours. - B: Refresh rate: Use the arrow icon to refresh the dashboard, and/or use the drop-down next to it to set the automatic refresh rate.
- C: Load Balancer name: Click this drop-down to select which of your Load Balancers you want to display metrics for.
- D: Frontend name: Click this drop-down to select which of your Load Balancer's frontends you want to display metrics for. You can select all attached frontends, or limit the display to only certain frontends.
- E: Backend name: Click this drop-down to select which of your Load Balancer's backends you want to display metrics for. You can select all attached backends, or limit the display to only certain backends.
Load Balancer status
In this section, you see various graphs which report on the status of different components of your Load Balancer.
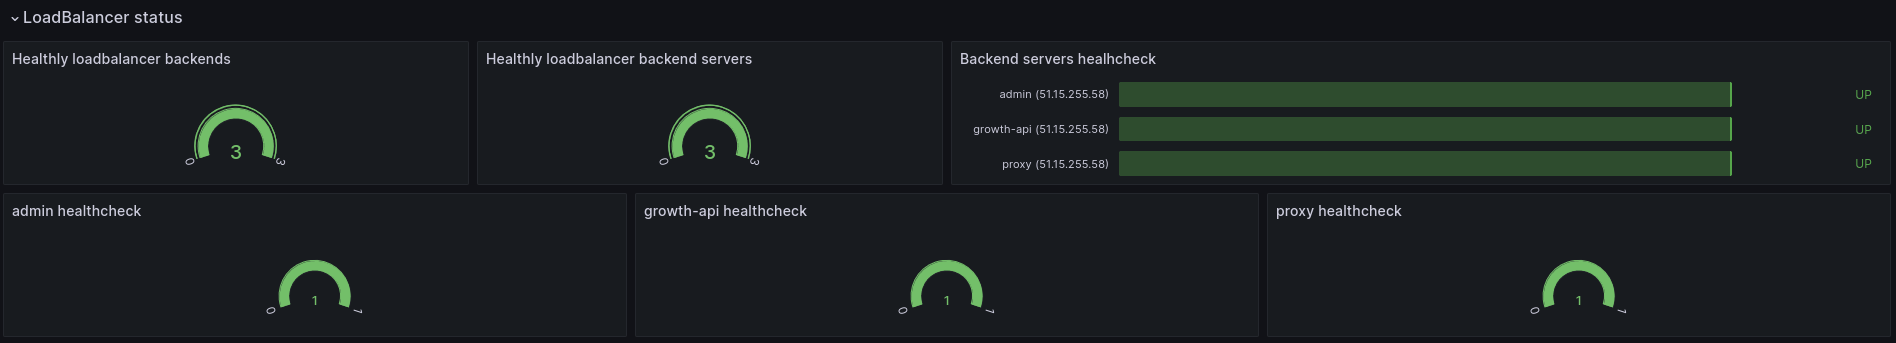
- Healthy loadbalancer backends: Shows how many of your Load Balancer's backends currently have a healthy status. A backend is considered healthy if at least one of its backend servers is healthy and up.
- Healthy loadbalancer backend servers: Shows how many of your Load Balancer's backend servers are currently in a healthy state. A backend server is considered healthy if it passes its health checks, specifically if the number of failed health checks does not exceed the value set in the
Unhealthy thresholdparameter. - Backend servers health check: Shows, for each backend server identified by its IP address and the name of the frontend it is attached to, its current status (
up(i.e. healthy), ordown(unhealthy)). - "Backend name" health check: Shows, for each backend identified by its name, how many of its backend servers are currently in a healthy state.
Backend and frontend delivered/received throughputs
In this section, you see various graphs detailing the delivered and received throughput for your Load Balancer. That is to say, you see the amount of data passing through its frontends, backends, and backend servers.
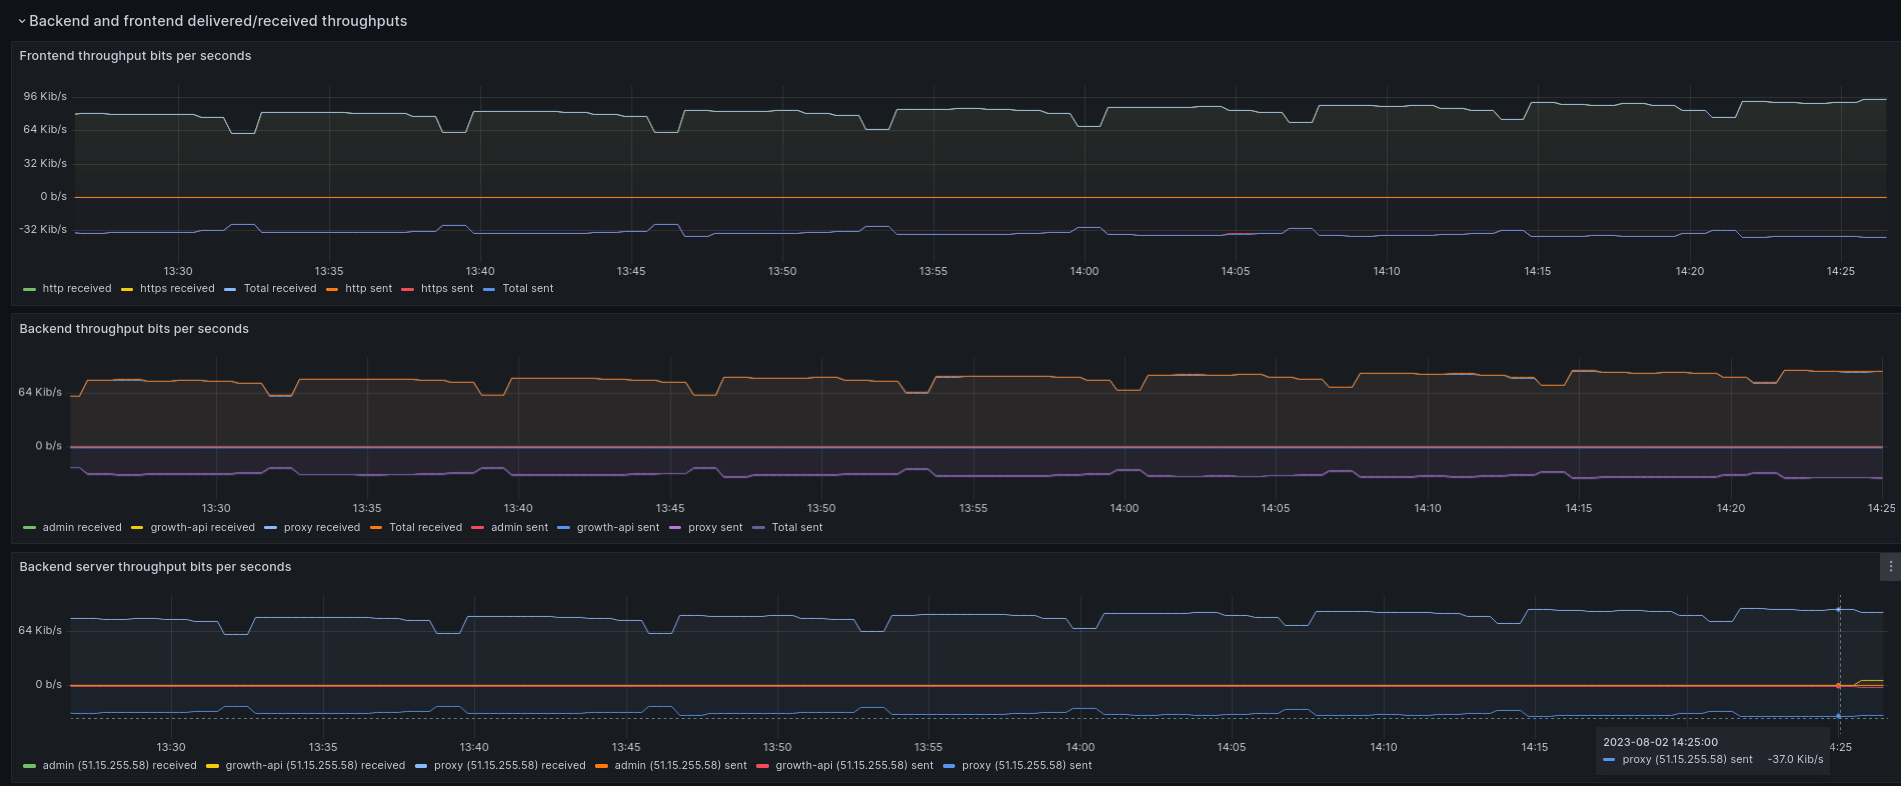
- Frontend throughput bits per seconds: Data is reported for each frontend (in the example above, for two frontends called
httpandhttps). The total combined data is also shown. In each case, the graph shows the data received (from clients) and sent (to the backend). - Backend throughput bits per seconds: Data is reported for each backend (in the example above, for three backends called
admin,growth-apiandproxy). The total combined data is also shown. In each case, the graph shows the data received (from the frontend) and sent (to the backend server). - Backend server throughput bits per seconds: Data is reported for each backend server, identified by its IP address and the backend it is attached to. The total combined data is also shown. In each case, the graph shows the data received and sent.
Active connections
In this section, you see various graphs detailing the current number of active connections for your Load Balancer.
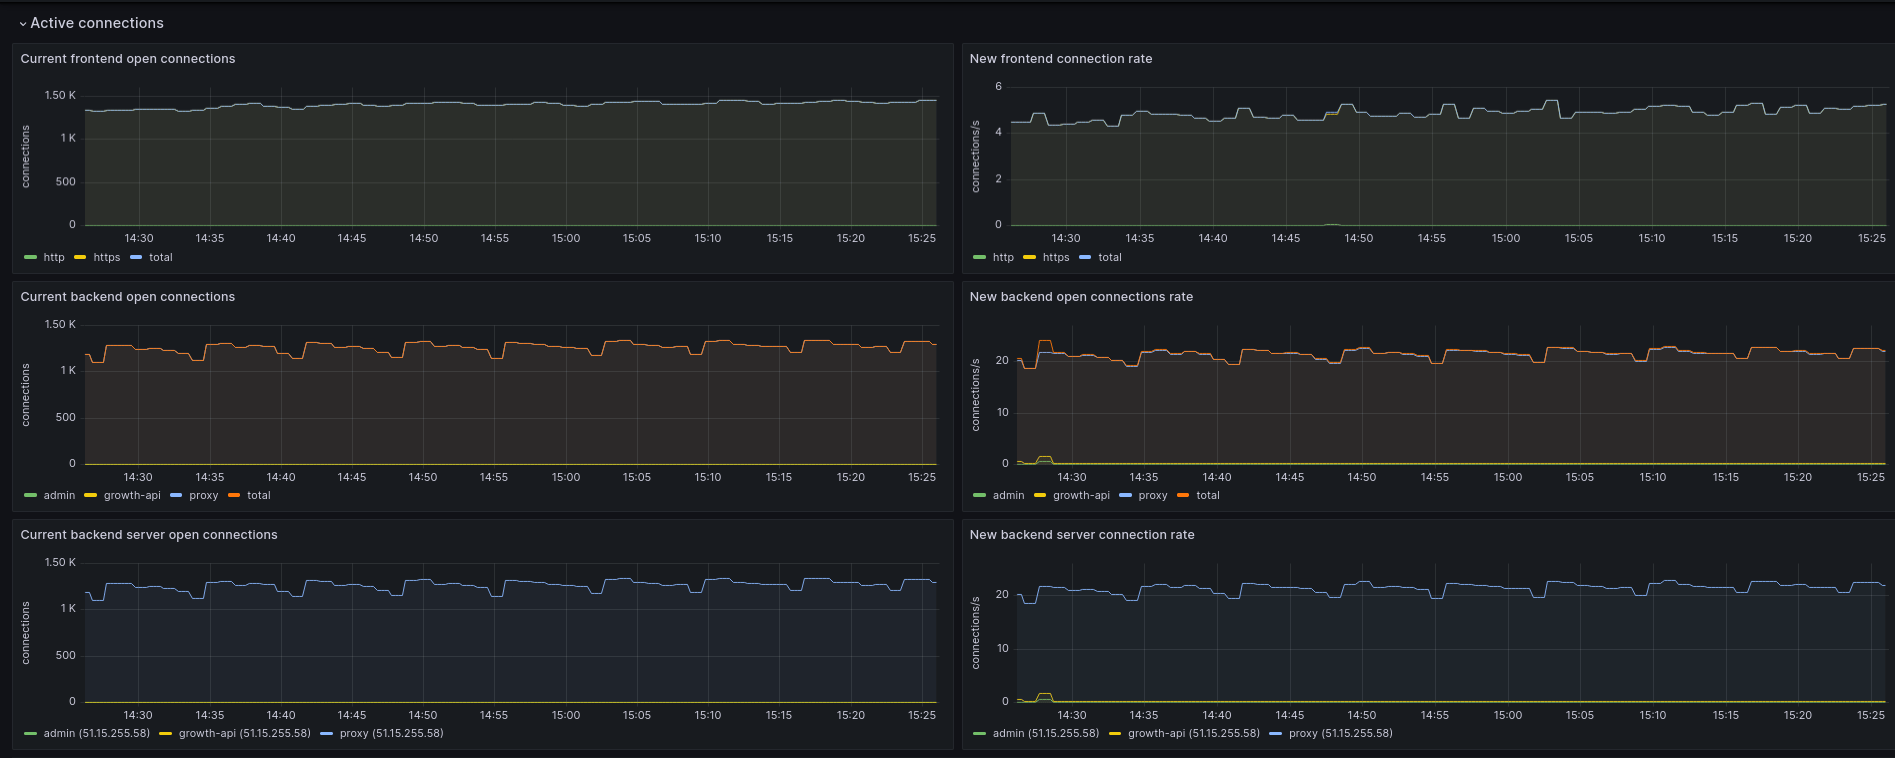
- For each frontend, backend and backend server, you can view:
- The number of current open connections.
- The rate of new connections (i.e. the number of new connections, as opposed to pre-established connections, per second)
Layer 7
In this section, you see various graphs detailing the layer 7 (application layer) actions of your Load Balancer.
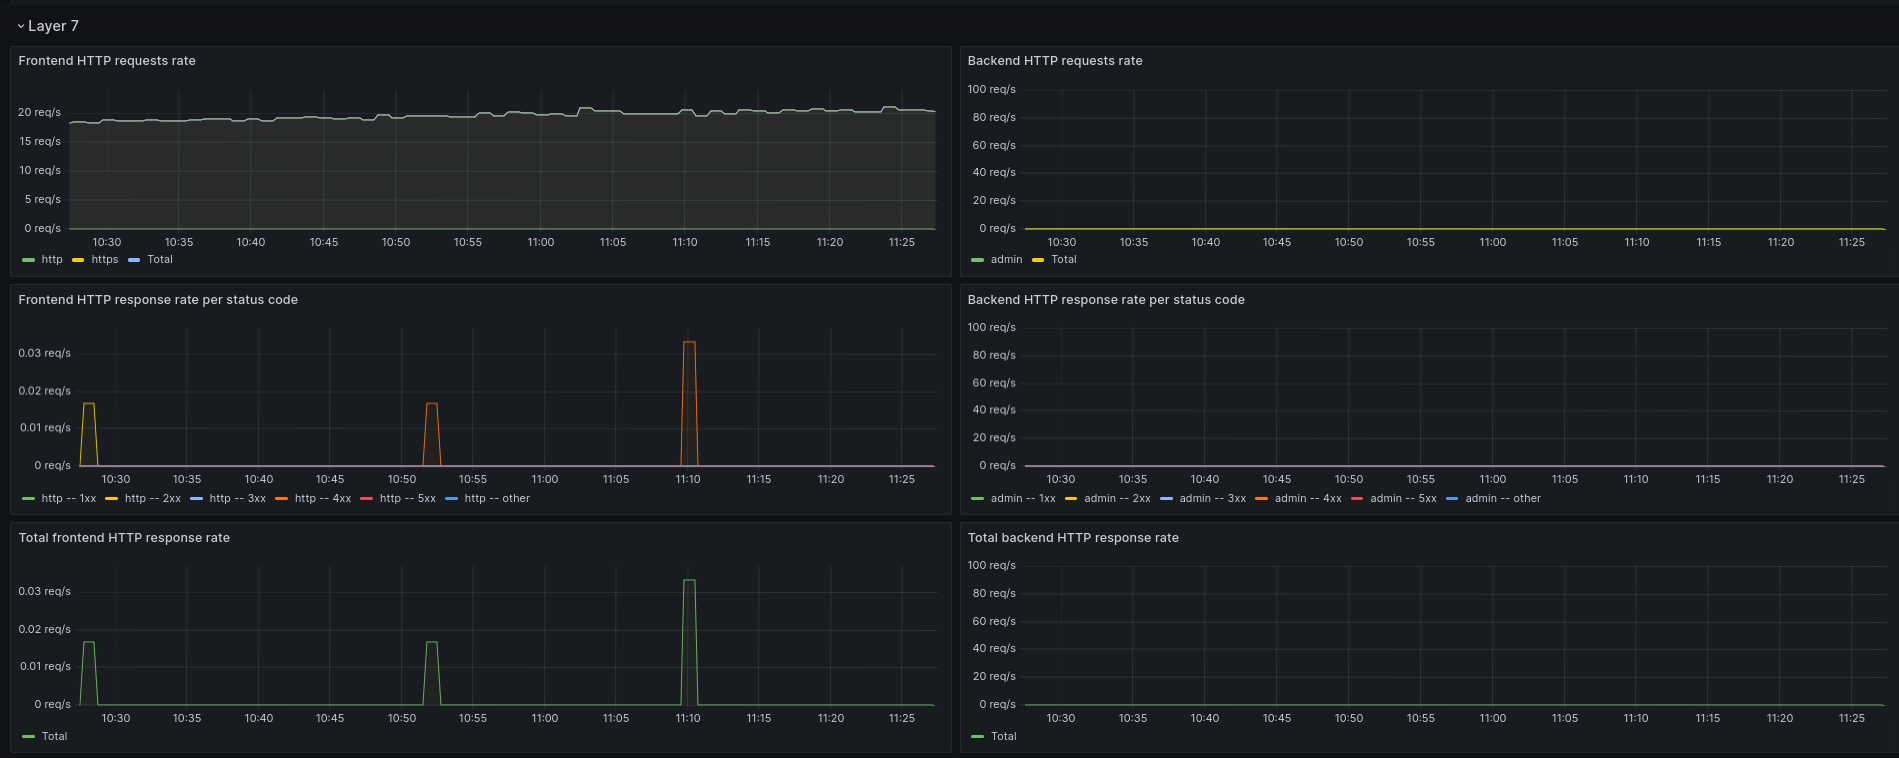
- For each frontend, backend and backend server, you can view:
- The HTTP request rate
- The HTTP response rate per status code
How to view and understand your Load Balancer logs
From the Scaleway Cockpit dashboards homepage, click Dashboards in the side menu, and select LB Logs Overview.
You are directed to the Load Balancer Logs Overview dashboard.
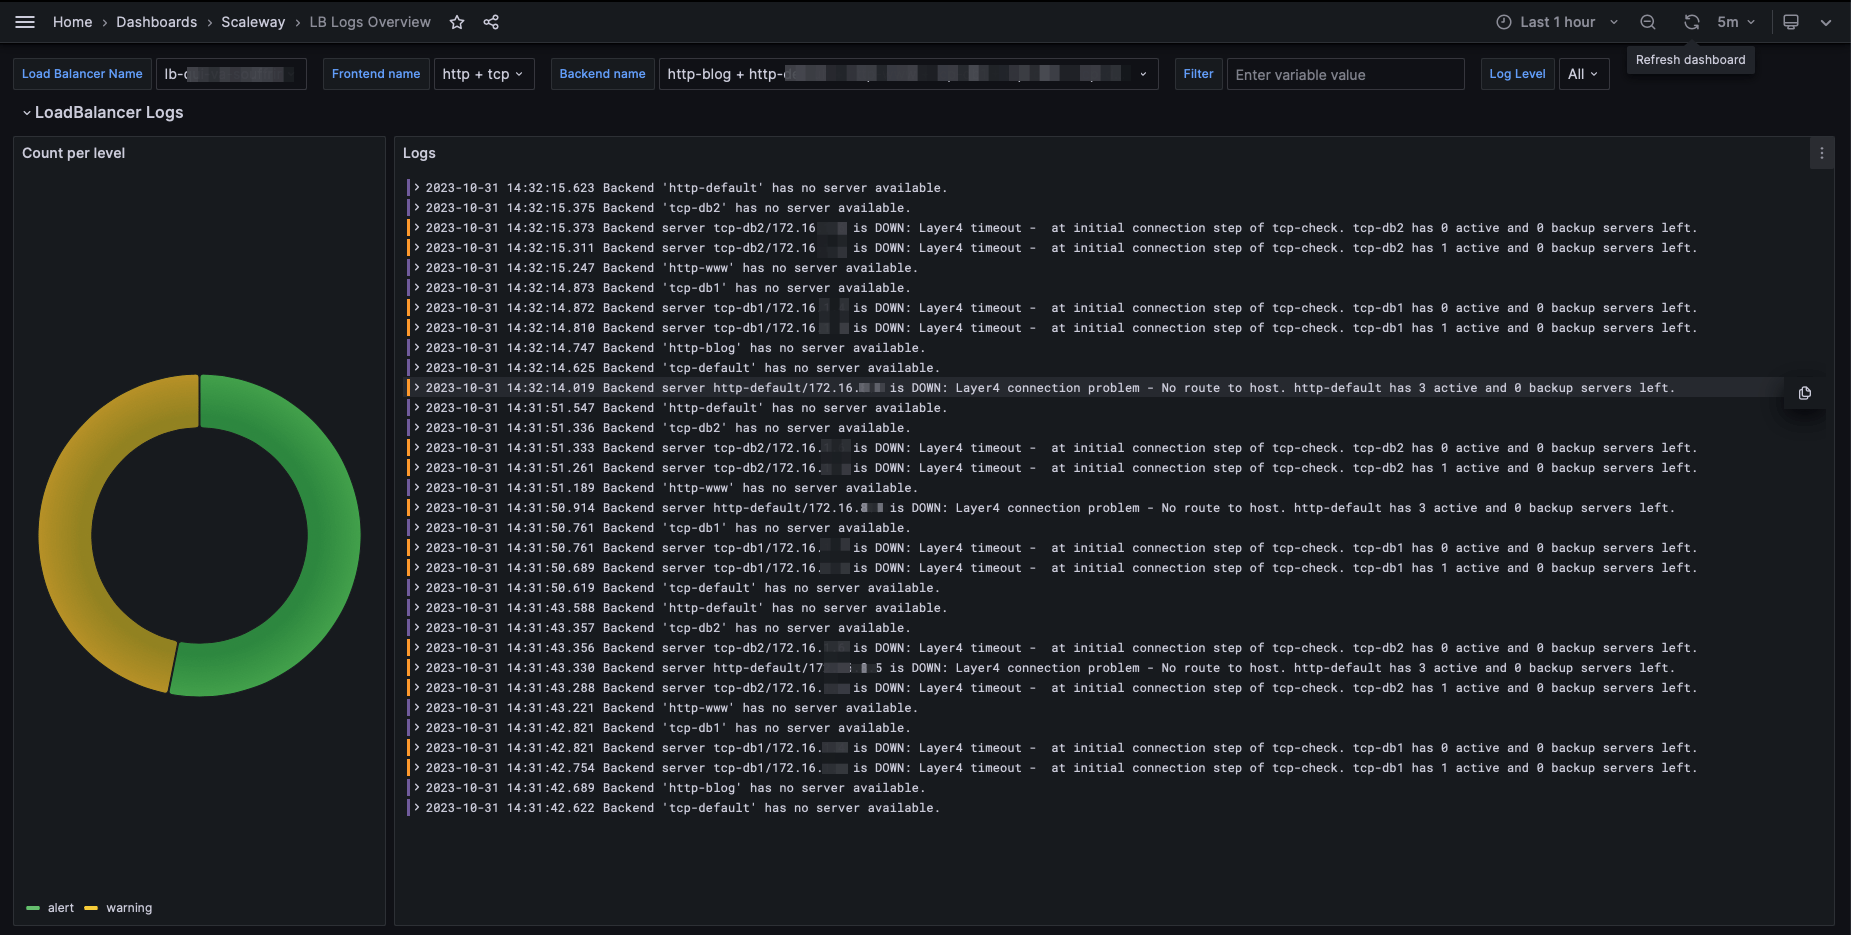
Choosing log parameters
At the top of the dashboard, you can configure parameters, which control which logs are displayed. In addition to all the same parameters as for metrics, you can also filter for specific log values, and select the log level (info, warning, alert).
Logged events
The following events are logged:
Backend server down
Logs when a backend server becomes inaccessible.
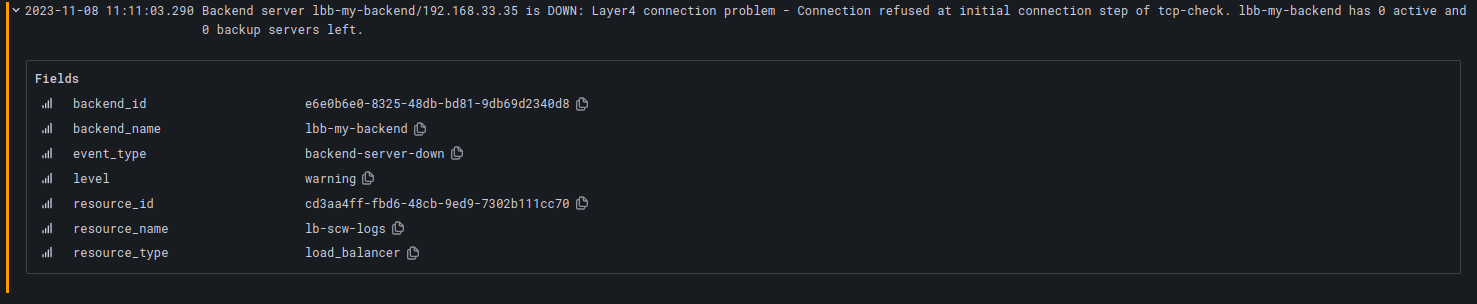
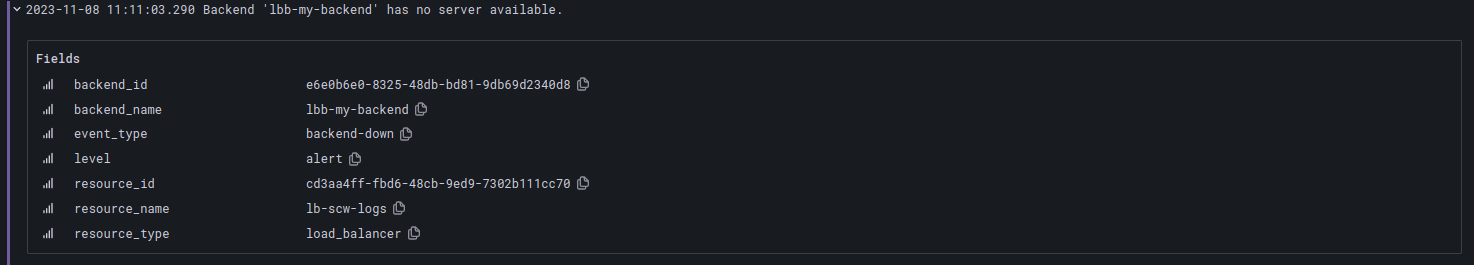
Backend down
Logs when all the backend servers of a backend become inaccessible.
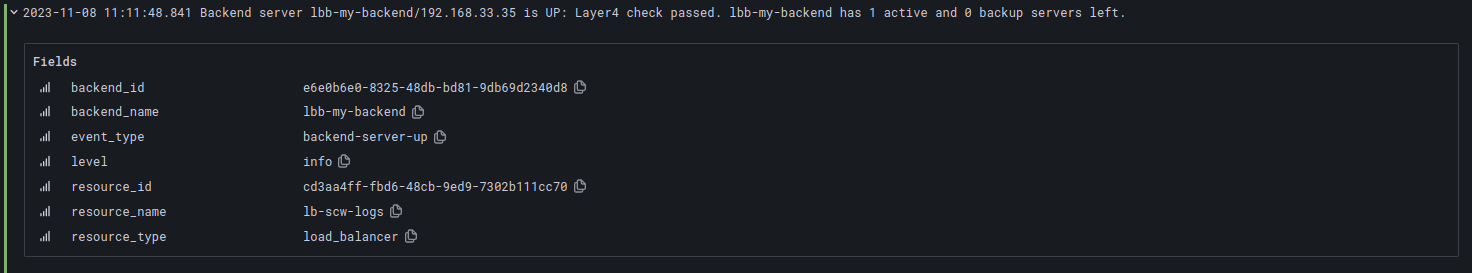
Backend server up
Logs when a backend server that was previously inaccessible becomes accessible again.
Certificate expired
Logs when a frontend's SSL/TLS certificate is about to expire or has expired.