How to configure alerts for Scaleway resources in Grafana
Cockpit does not support Grafana-managed alerting. It integrates with Grafana to visualize metrics, but alerts are managed through the Scaleway alert manager. You should use Grafana only to define alert rules, not to evaluate or receive alert notifications. Once the conditions of your alert rule are met, the Scaleway alert manager evaluates the rule and sends a notification to the contact points you have configured in the Scaleway console or in Grafana.
This page shows you how to create alert rules in Grafana for monitoring Scaleway resources integrated with Cockpit, such as Instances, Object Storage, and Kubernetes. These alerts rely on Scaleway-provided metrics, which are preconfigured and available in the Metrics browser drop-down when using the Scaleway Metrics data source in the Grafana interface. This page explains how to use the Scaleway Metrics data source, interpret metrics, set alert conditions, and activate alerts.
Before you start
To complete the actions presented below, you must have:
- A Scaleway account logged into the console
- Owner status or IAM permissions allowing you to perform actions in the intended Organization
- Scaleway resources you can monitor
- Created Grafana credentials with the Editor role
- Enabled the Scaleway alert manager
- Created a contact point in the Scaleway console or in Grafana (with the
Scaleway Alertingalert manager of the same region as yourScaleway Metricsdata source), otherwise alerts will not be delivered
Switch to data source managed alert rules
Data source managed alert rules allow you to configure alerts managed by the data source of your choice, instead of using Grafana's managed alerting system which is not supported by Cockpit.
- Log in to Grafana using your credentials.
- Click the Toggle menu then click Alerting.
- Click Alert rules and + New alert rule.
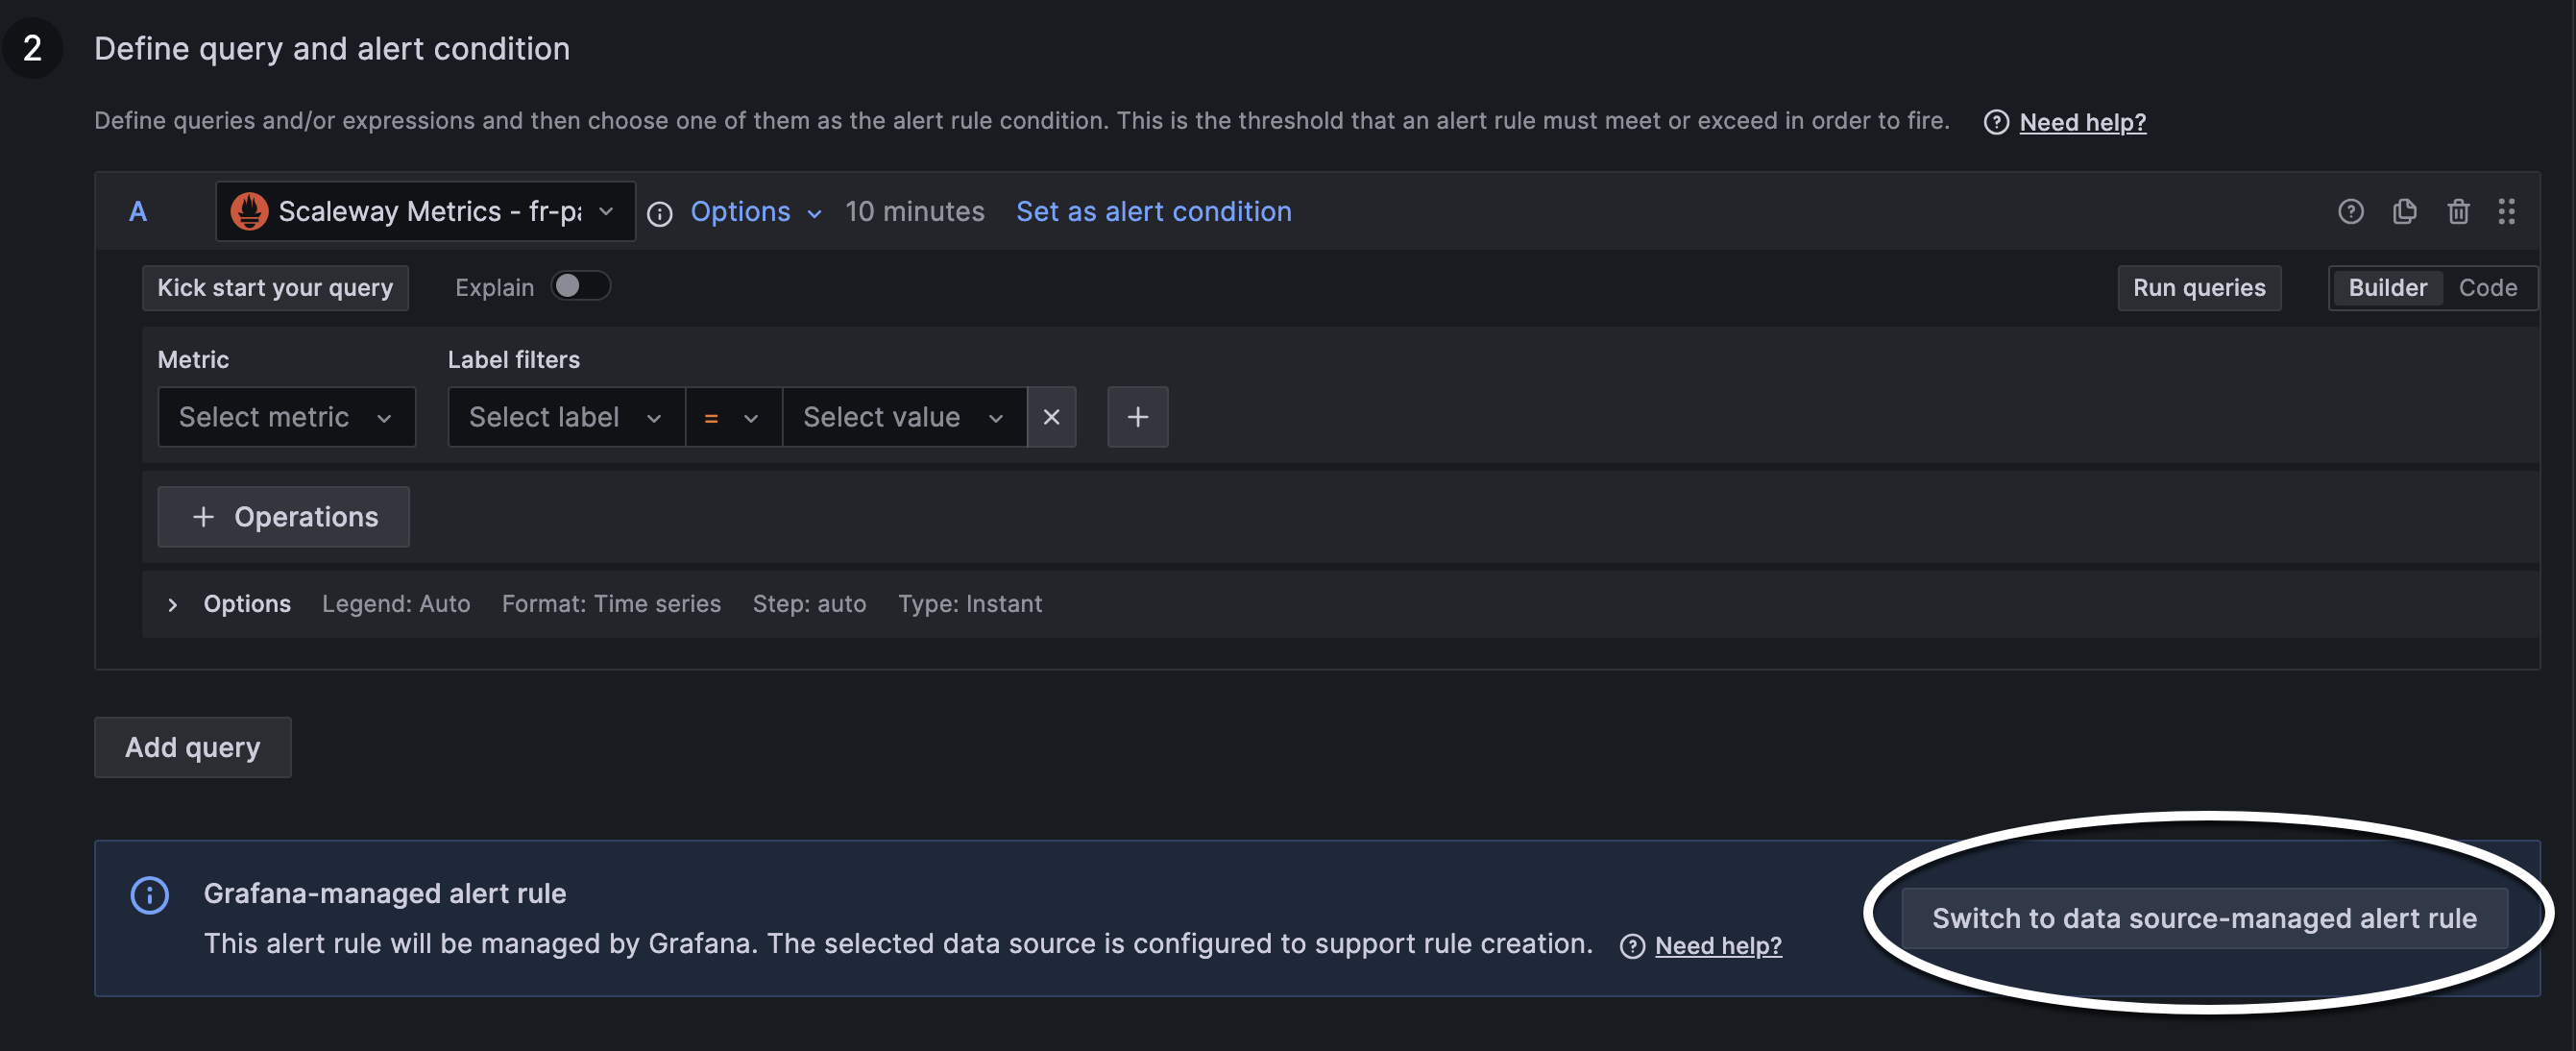
- In the Define query and alert condition section, scroll to the Grafana-managed alert rule information banner and click Switch to data source-managed alert rule. This step is mandatory because Cockpit does not support Grafana’s built-in alerting system, but only alerts configured and evaluated by the data source itself. You are redirected to the alert creation process.
Define your metric and alert conditions
Switch between the tabs below to create alerts for a Scaleway Instance, an Object Storage bucket, a Kubernetes cluster pod, or Cockpit logs.
The steps below explain how to create the metric selection and configure an alert condition that triggers when your Instance consumes more than 10% of a single CPU core over the past 5 minutes.
- Type a name for your alert. For example,
alert-for-high-cpu-usage. - Select the Scaleway Metrics data source.
- Click the Metrics browser drop-down.

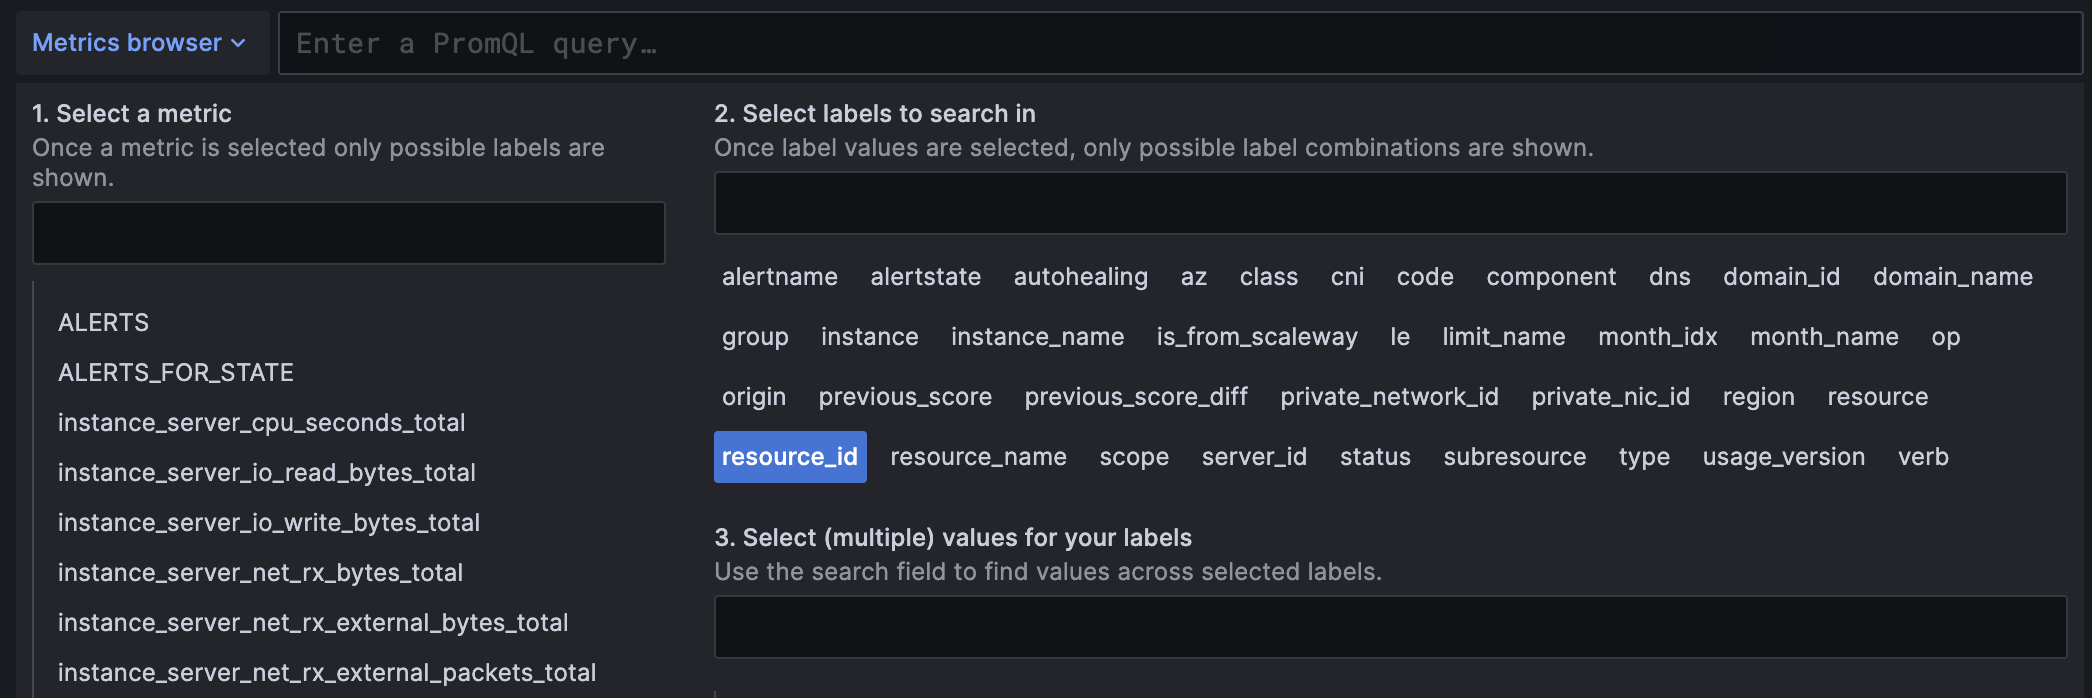
- Select the metric you want to configure an alert for. For example,
instance_server_cpu_seconds_total. - Select the appropriate labels to filter your metric and target specific resources.
- Choose values for your selected labels. The Resulting selector field displays your final query selector.

- Click Use query to validate your metric selection.
- In the query field next to the Metrics browser button, paste the following query. Make sure that the values for the labels you have selected (for example,
resource_idandresource_name) correspond to those of the target resource.rate(instance_server_cpu_seconds_total{resource_id="xxxxxxxx-xxxx-xxxx-xxxx-xxxxxxxxxxxx",resource_name="name-of-your-resource"}[5m]) > 0.1 - In the Set alert evaluation behavior field, specify how long the condition must be true before triggering the alert.
- Enter a name in the Namespace and Group fields to categorize and manage your alert, and optionally, add annotations.
- Enter a label in the Labels field and a name in the Value field. You can skip this step if you want your alerts to be sent to the contact points you may already have created in the Scaleway console.
- Click Save rule in the top right corner of your screen to save and activate your alert.
- Optionally, check that your configuration works by temporarily lowering the threshold. This will trigger the alert and notify your contact point.
The steps below explain how to create the metric selection and configure an alert condition that triggers when the object count in your bucket exceeds a specific threshold.
- Type a name for your alert.
- Select the Scaleway Metrics data source.
- Click the Metrics browser drop-down.


- Select the metric you want to configure an alert for. For example,
object_storage_bucket_objects_total. - Select the appropriate labels to filter your metric and target specific resources.
- Choose values for your selected labels. The Resulting selector field displays your final query selector.
- Click Use query to validate your metric selection. Your selection displays in the query field next to the Metrics browser button. This prepares it for use in the alert condition, which we will define in the next steps.
- In the query field, paste the following query. Make sure that the values for the labels you have selected (for example,
resource_idandregion) correspond to those of the target resource.object_storage_bucket_objects_total{region="fr-par", resource_id="my-bucket"} > 2000 - In the Set alert evaluation behavior field, specify how long the condition must be true before triggering the alert.
- Enter a name in the Namespace and Group fields to categorize and manage your alert, and optionally, add annotations.
- Enter a label in the Labels field and a name in the Value field. You can skip this step if you want your alerts to be sent to the contact points you may already have created in the Scaleway console.
- Click Save rule in the top right corner of your screen to save and activate your alert.
- Optionally, check that your configuration works by temporarily lowering the threshold. This will trigger the alert and notify your contact point.
The steps below explain how to create the metric selection and configure an alert condition that triggers when no new pod activity occurs, which could mean your cluster is stuck or unresponsive.
- Type a name for your alert.
- Select the Scaleway Metrics data source.
- Click the Metrics browser drop-down.


- Select the metric you want to configure an alert for. For example,
kubernetes_cluster_k8s_shoot_nodes_pods_usage_total. - Select the appropriate labels to filter your metric and target specific resources.
- Choose values for your selected labels. The Resulting selector field displays your final query selector.
- Click Use query to validate your metric selection. Your selection displays in the query field next to the Metrics browser button. This prepares it for use in the alert condition, which we will define in the next steps.
- In the query field, paste the following query. Make sure that the values for the labels you have selected (for example,
resource_name) correspond to those of the target resource.rate(kubernetes_cluster_k8s_shoot_nodes_pods_usage_total{resource_name="k8s-par-quizzical-chatelet"}[15m]) == 0 - In the Set alert evaluation behavior field, specify how long the condition must be true before triggering the alert.
- Enter a name in the Namespace and Group fields to categorize and manage your alert, and optionally, add annotations.
- Enter a label in the Labels field and a name in the Value field. You can skip this step if you want your alerts to be sent to the contact points you may already have created in the Scaleway console.
- Click Save rule in the top right corner of your screen to save and activate your alert.
- Optionally, check that your configuration works by temporarily lowering the threshold. This will trigger the alert and notify your contact point.
The steps below explain how to create the metric selection and configure an alert condition that triggers when no logs are stored for 5 minutes, which may indicate your app or system is broken.
- Type a name for your alert.
- Select the Scaleway Metrics data source.
- Click the Metrics browser drop-down.


- Select the metric you want to configure an alert for. For example,
observability_cockpit_loki_chunk_store_stored_chunks_total:increase5m. - Select the appropriate labels to filter your metric and target specific resources.
- Choose values for your selected labels. The Resulting selector field displays your final query selector.
- Click Use query to validate your metric selection. Your selection displays in the query field next to the Metrics browser button. This prepares it for use in the alert condition, which we will define in the next steps.
- In the query field, paste the following query. Make sure that the values for the labels you have selected (for example,
resource_name) correspond to those of the target resource.observability_cockpit_loki_chunk_store_stored_chunks_total:increase5m{resource_id="xxxxxxxx-xxxx-xxxx-xxxx-xxxxxxxxxxxx"} == 0 - In the Set alert evaluation behavior field, specify how long the condition must be true before triggering the alert.
- Enter a name in the Namespace and Group fields to categorize and manage your alert, and optionally, add annotations.
- Enter a label in the Labels field and a name in the Value field. You can skip this step if you want your alerts to be sent to the contact points you may already have created in the Scaleway console.
- Click Save rule in the top right corner of your screen to save and activate your alert.
- Optionally, check that your configuration works by temporarily lowering the threshold. This will trigger the alert and notify your contact point.
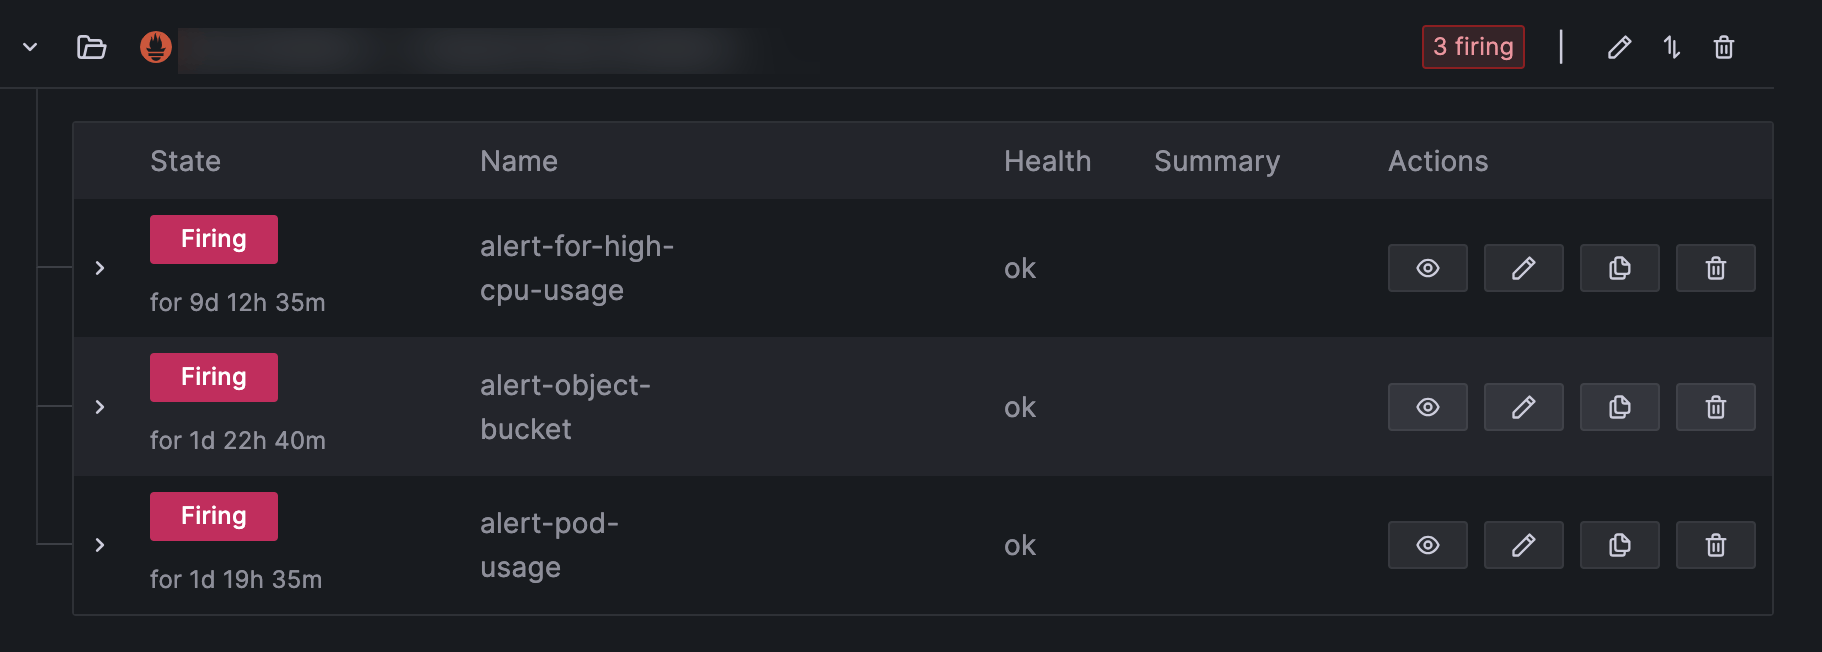
You can view your firing alerts in the Alert rules section of your Grafana (Home > Alerting > Alert rules).
