Load Testing with Vegeta
Vegeta load testing
Load testing involves subjecting an application to real-world conditions through the simulation of concurrent user requests. This practice helps you understand how an application behaves when accessed by numerous users, simultaneously. This guide explains how to use Vegeta, an open-source tool coded in the Go programming language, to execute load tests on an application.
Before transitioning an application to a production environment, load testing helps you unearth the following issues:
- Assessment of response times for individual requests
- Evaluation of overall system performance under varying loads
- Scrutiny of database performance during intense usage
- Validation of load balancing efficacy as per design
- Determination of network latency between client and application
- Identification of performance constraints attributed to technical specifications of employed Instances
Before you start
To complete the actions presented below, you must have:
- A Scaleway account logged into the console
- Owner status or IAM permissions allowing you to perform actions in the intended Organization
- An SSH key
- An Instance running on Ubuntu Linux
Downloading and installing Vegeta on Ubuntu Linux
- Connect to your Instance via SSH.
- Download the latest binary version to install Vegeta on your Ubuntu Linux machine:
wget https://github.com/tsenart/vegeta/releases/download/v12.12.0/vegeta_12.12.0_linux_amd64.tar.gz - Unpack the binary file:
tar xfz vegeta-12.11.0-linux-amd64.tar.gz - Move the binary file into
/usr/binto make it available system-wide. This step actually installs the Vegeta application on your Ubuntu system:mv vegeta /usr/bin/vegeta
Running a load test with Vegeta
To run a load test during 120 seconds, run the following command. It allows you to test the performance using Vegeta:
echo "GET http://<application_url>/" | vegeta attack -duration=120s | tee results.bin | vegeta reportThe command above will return a report like the following:
Requests      [total, rate]            6000, 50.01
Duration      [total, attack, wait]    2m0.072491358s, 1m59.980003112s, 92.488246ms
Latencies     [mean, 50, 95, 99, max]  76.235976ms, 72.996349ms, 109.192641ms, 133.960662ms, 187.907358ms
Bytes In      [total, mean]            65862000, 10977.00
Bytes Out     [total, mean]            0, 0.00
Success       [ratio]                  100.00%
Status Codes  [code:count]             200:6000
Error Set:Requestsshows the total number of requests sent during the test and the rate of the requests.Durationshows the total duration of the test, the attack period simulating load on the application and the wait time.Latenciesshows the mean latency, 50th, 95th and 99th percentiles, respectively, of the latencies of all requests in an attack as well as the maximum latency recognized.Bytes InandBytes Outshows:- The
totalnumber of bytes sent (out) or received (in) with the request or response bodies. - The
meannumber of bytes sent (out) or received (in) with the request or response bodies.
- The
Successshows the percentiles of successful requests sent to the application.Status Codesprovides a counter of the HTTP response codes received and their occurrence. A0status codes mean a request failed to be sent.
As visible in the example above, 100 % of the requests sent to the application were successful.
Following another result:
Requests      [total, rate]            6000, 50.01
Duration      [total, attack, wait]    2m9.500461177s, 1m59.980081991s, 9.520379186s
Latencies     [mean, 50, 95, 99, max]  843.903272ms, 77.954318ms, 3.744635321s, 25.164627897s, 30.000611567s
Bytes In      [total, mean]            62842863, 10473.81
Bytes Out     [total, mean]            0, 0.00
Success       [ratio]                  95.38%
Status Codes  [code:count]             0:45  200:5723  500:33  502:13  503:186
Error Set:
500 Internal Server Error
502 Bad Gateway
Get http://<application_url>/: EOF
503 Service Unavailable
Get http://<application_url>/: net/http: request canceled (Client.Timeout exceeded while awaiting headers)
As visible in the output above, only 95.38% of the requests sent to the application were successful. In the Status Code section, it is visible that 5723 requests were successful (HTTP Code 200), 186 requests received an HTTP 503 error, and 13 requests received an HTTP 502 error.
These results show that the application has trouble handling the load and needs optimization.
Setting up a target file
Vegeta also supports multiple targets to attack an application with multiple endpoints simultaneously. This allows you to test the performance of your application (e.g. an API) with Vegeta:
-
Create a target file and open it in a text editor:
nano target.list -
Put the different endpoints into it:
GET http://<application_url>/list/user/1
GET http://<application_url>/list/user/2
GET http://<application_url>/list/user/3
It is also possible to define
POSTorPUTcommands into the file.POST http://<application_url>/create/newuser/ Content-Type: application/json @/path/to/newuser.jsonThe content of the file
/path/to/newuser.jsoncontains the body of the request:{ "name": "Peter"; "lastname": "Smith"; "email": "psmith@example.com" } -
Run Vegeta, the
-durationflag specifies the duration of the attack, the-rateflag defines the number of requests per time unit (the default value is set to 50/1s):vegeta attack -duration=5s -rate=5 -targets=target.list
Generating a report
Every load test executed to collect data can be saved in an output file using the -output parameter.
The data collected during each load test is stored in an output file.
-
Run an attack in Vegeta. The default filename of the output file is
results.bin. It can be specified to any name with the-outputflag:vegeta attack -duration=120s -rate=100 -targets=target.list -output=attack-5.bin -
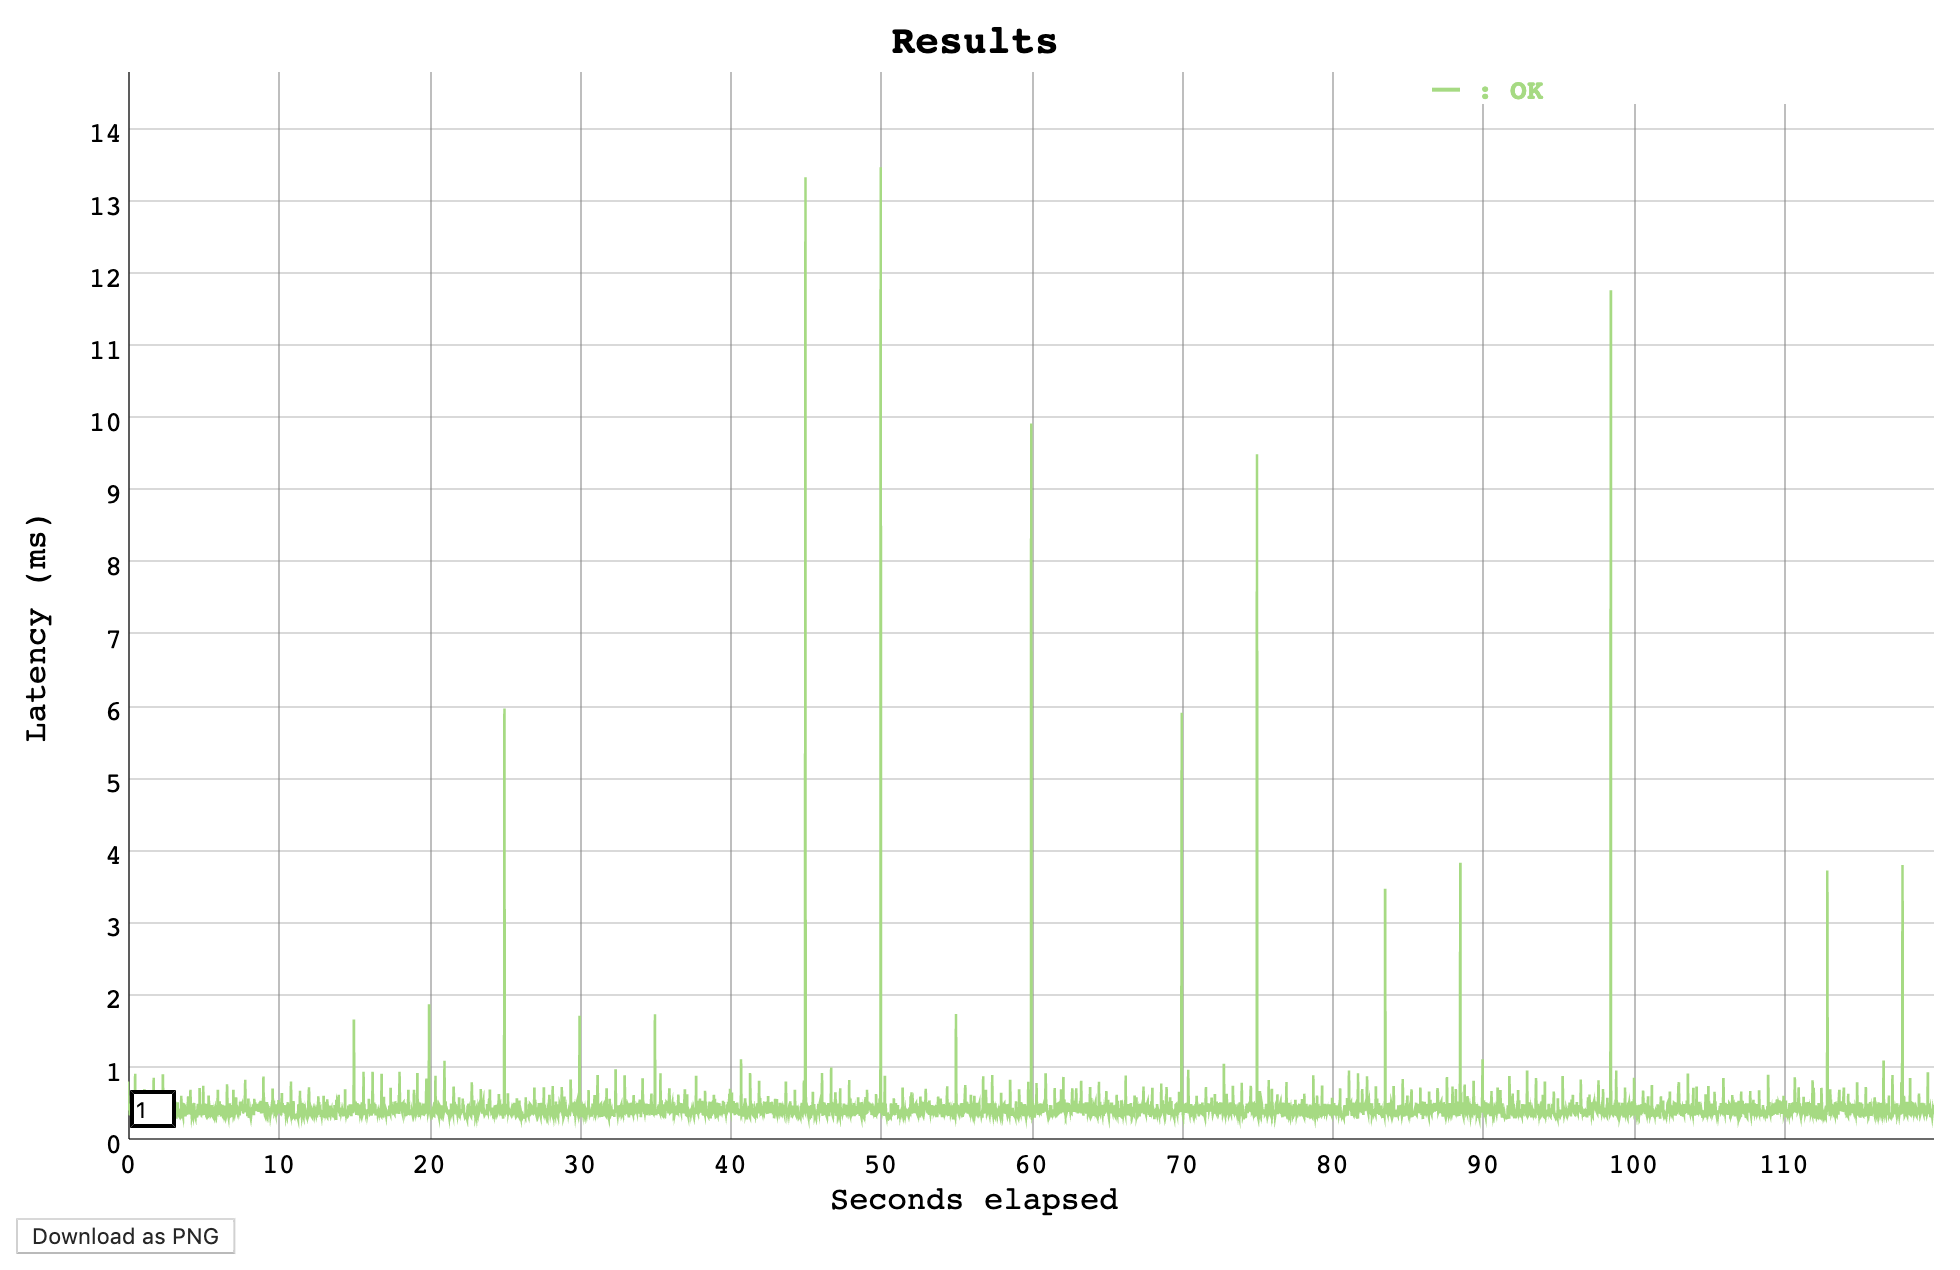
Generate the HTML report and plot with the
vegeta plotcommand. The-titleflag allows specifying a title for the plot.vegeta plot -title=Attack%20Results attack-5.bin > results.html -
Open the HTML file in a web browser to view the plot:
-
Alternatively, it is also possible to generate the report as JSON output:
vegeta report -type=json results.binReturning a JSON output as follows:
{ "latencies":{ "total":5018316104, "mean":418193, "50th":393268, "95th":523664, "99th":737809, "max":13479790 }, "bytes_in":{ "total":7344000, "mean":612 }, "bytes_out":{ "total":0, "mean":0 }, "earliest":"2019-05-23T15:14:25.216411448+02:00", "latest":"2019-05-23T15:16:25.206316941+02:00", "end":"2019-05-23T15:16:25.206710805+02:00", "duration":119989905493, "wait":393864, "requests":12000, "rate":100.00841279685865, "success":1, "status_codes":{ "200":12000 }, "errors":[ ] } -
To view the report directly in the terminal, run:
vegeta report results.binWhich provides a report in the format seen in the first steps:
Requests      [total, rate]            12000, 100.01
Duration      [total, attack, wait]    1m59.990299357s, 1m59.989905493s, 393.864µs
Latencies     [mean, 50, 95, 99, max]  418.193µs, 393.268µs, 523.664µs, 737.809µs, 13.47979ms
Bytes In      [total, mean]            7344000, 612.00
Bytes Out     [total, mean]            0, 0.00
Success       [ratio]                  100.00%
Status Codes  [code:count]             200:12000
Error Set:
For more information about Vegeta, refer to the official documentation.
Visit our Help Center and find the answers to your most frequent questions.
Visit Help Center