
Configuring a Prometheus monitoring Instance with a Grafana dashboard
- compute
- monitoring
- Grafana
- Prometheus
- Instance
- statistics
Prometheus is a flexible monitoring solution that is in development since 2012. The software stores all its data in a time series database and offers a multi-dimensional data-model and a powerful query language to generate reports of the monitored resources.
In this tutorial you learn, how to use a Prometheus Monitoring Instance with a Grafana dashboard.
We recommend you follow this tutorial using a Production-Optimized Instance.
You may need certain IAM permissions to carry out some actions described on this page. This means:
- you are the Owner of the Scaleway Organization in which the actions will be carried out, or
- you are an IAM user of the Organization, with a policy granting you the necessary permission sets
- You have an account and are logged into the Scaleway console
- You have configured your SSH key
- You have a Scaleway Instance running Ubuntu Focal Fossa (20.04 LTS) or later
Preparing your environment
-
Run the following command to create a user for Prometheus and Node Exporter. In this tutorial, we will create it without the login option.
To achieve this, we use the parameter
--no-create-home
which skips the creation of a home directory and disable the shell with--shell /usr/sbin/nologin
.useradd --no-create-home --shell /usr/sbin/nologin prometheususeradd --no-create-home --shell /bin/false node_exporter -
Create the folders required to store the binaries of Prometheus and its configuration files.
mkdir /etc/prometheusmkdir /var/lib/prometheus -
Set the ownership of these directories to our
prometheus
user, to make sure that Prometheus can access to these folders.chown prometheus:prometheus /etc/prometheuschown prometheus:prometheus /var/lib/prometheus
Downloading and installing Node Exporter
As your Prometheus is only capable of collecting metrics, we want to extend its capabilities by adding Node Exporter, a tool that collects information about the system including CPU, disk, and memory usage and exposes them for scraping.
-
Download the latest version of Node Exporter:
wget https://github.com/prometheus/node_exporter/releases/download/v1.5.0/node_exporter-1.5.0.linux-amd64.tar.gz -
Unpack the downloaded archive. This will create a directory
node_exporter-1.5.0.linux-amd64
, containing the executable, a readme and license file:tar xvf node_exporter-1.5.0.linux-amd64.tar.gz -
Copy the binary file into the directory
/usr/local/bin
and set the ownership to the user you have created in step previously:cp node_exporter-1.5.0.linux-amd64/node_exporter /usr/local/binchown node_exporter:node_exporter /usr/local/bin/node_exporter -
Remove the leftover files of Node Exporter, as they are not needed any longer:
rm -rf node_exporter-1.5.0.linux-amd64.tar.gz node_exporter-1.5.0.linux-amd64 -
To run Node Exporter automatically on each boot, a systemd service file is required. Create the following file by opening it in Nano:
nano /etc/systemd/system/node_exporter.service -
Copy the following information in the service file, save it and exit
nano
:[Unit]Description=Node ExporterWants=network-online.targetAfter=network-online.target[Service]User=node_exporterGroup=node_exporterType=simpleExecStart=/usr/local/bin/node_exporter[Install]WantedBy=multi-user.targetTip:Collectors are used to gather information about the system. By default, a set of collectors is activated. You can see the details about the set in the README file. If you want to use a specific set of collectors, you can define them in the
ExecStart
section of the service. Collectors are enabled by providing a--collector.<name>
flag. Collectors that are enabled by default can be disabled by providing a--no-collector.<name>
flag. -
Reload Systemd to use the newly defined service.
systemctl daemon-reload -
Run Node Exporter by typing the following command.
systemctl start node_exporter.service -
Verify that the software started successfully.
systemctl status node_exporter.serviceYou will see an output like the following, showing you the status
active (running)
as well as the main PID of the application:● node_exporter.service - Node ExporterLoaded: loaded (/etc/systemd/system/node_exporter.service; disabled; vendor preset: enabled)Active: active (running) since Thu 2023-02-23 14:27:05 UTC; 10s agoMain PID: 1603 (node_exporter)Tasks: 5 (limit: 4111)Memory: 2.7MCPU: 14msCGroup: /system.slice/node_exporter.service└─1603 /usr/local/bin/node_exporter -
If everything is working, enable Node Exporter to start upon boot.
systemctl enable node_exporter.service
Downloading and installing Prometheus
-
Download and unpack Prometheus latest release of Prometheus. In this tutorial, we use version 2.42.0.
apt-get update && apt-get upgradewget https://github.com/prometheus/prometheus/releases/download/v2.42.0/prometheus-2.42.0.linux-amd64.tar.gztar xfz prometheus-*.tar.gzcd prometheus-2.42.0.linux-amd64/The following two binaries are in the directory:
- prometheus - Prometheus’ main binary file
- promtool
The following two folders (which contain the web interface, configuration files examples and the license) are in the directory:
- consoles
- console_libraries
-
Copy the binary files into the
/usr/local/bin/
directory:cp ./prometheus /usr/local/bin/cp ./promtool /usr/local/bin/ -
Set the ownership of these files to the
prometheus
user previously created:chown prometheus:prometheus /usr/local/bin/prometheuschown prometheus:prometheus /usr/local/bin/promtool -
Copy the
consoles
andconsole_libraries
directories to/etc/prometheus
:cp -r ./consoles /etc/prometheuscp -r ./console_libraries /etc/prometheus -
Set the ownership of the two folders, as well as of all files that they contain, to our
prometheus
user:chown -R prometheus:prometheus /etc/prometheus/consoleschown -R prometheus:prometheus /etc/prometheus/console_libraries -
In our home folder, remove the source files that are not needed anymore:
cd .. && rm -rf prometheus-\*
Configuring Prometheus
Prior to using Prometheus, it needs basic configuring. Thus, we need to create a configuration file named prometheus.yml
The configuration file of Prometheus is written in YAML which strictly forbids to use tabs. If your file is incorrectly formatted, Prometheus will not start. Be careful when you edit it.
-
Open the file
prometheus.yml
in a text editor:nano /etc/prometheus/prometheus.ymlPrometheus’ configuration file is divided into three parts:
global
,rule_files
, andscrape_configs
.In the
global
part we can find the general configuration of Prometheus:scrape_interval
defines how often Prometheus scrapes targets,evaluation_interval
controls how often the software will evaluate rules. Rules are used to create new time series and for the generation of alerts.The
rule_files
block contains information of the location of any rules we want the Prometheus Instance to load.The last block of the configuration file is named
scape_configs
and contains the information which resources Prometheus monitors.Our file should look like this example:
global:scrape_interval: 15sevaluation_interval: 15srule_files:# - "first.rules"# - "second.rules"scrape_configs:- job_name: 'prometheus'scrape_interval: 5sstatic_configs:- targets: ['localhost:9090']The global
scrape_interval
is set to 15 seconds which is enough for most use cases.We do not have any
rule_files
yet, so the lines are commented out and start with a#
.In the
scrape_configs
part we have defined our first exporter. It is Prometheus that monitors itself. As we want to have more precise information about the state of our Prometheus Instance we reduced thescrape_interval
to 5 seconds for this job. The parametersstatic_configs
andtargets
determine where the exporters are running. In our case it is the same Instance, so we uselocalhost
and the port9090
.As Prometheus scrapes only exporters that are defined in the
scrape_configs
part of the configuration file, we have to add Node Exporter to the file, as we did for Prometheus itself.We add the following part below the configuration for scrapping Prometheus:
- job_name: 'node_exporter'scrape_interval: 5sstatic_configs:- targets: ['localhost:9100']Overwrite the global scrape interval again and set it to 5 seconds. As we are scarping the data from the same Instance as Prometheus is running on, we can use
localhost
with the default port of Node Exporter:9100
.If you want to scrape data from a remote host, you have to replace
localhost
with the IP address of the remote Instance.Tip:For all information about the configuration of Prometheus, you may check the configuration documentation.
-
Set the ownership of the file to our
Prometheus
user:chown prometheus:prometheus /etc/prometheus/prometheus.yml
Our Prometheus Instance is ready to run for the first time.
Running Prometheus
-
Start Prometheus directly from the command line with the following command, which executes the binary file as our
Prometheus
user:sudo -u prometheus /usr/local/bin/prometheus --config.file /etc/prometheus/prometheus.yml --storage.tsdb.path /var/lib/prometheus/ --web.console.templates=/etc/prometheus/consoles --web.console.libraries=/etc/prometheus/console_librariesThe Instance starts displaying multiple status messages and the information that the Instance has started:
ts=2023-02-23T14:32:10.321Z caller=main.go:556 level=info msg="Starting Prometheus Server" mode=Instance version="(version=2.42.0, branch=HEAD, revision=225c61122d88b01d1f0eaaee0e05b6f3e0567ac0)"ts=2023-02-23T14:32:10.321Z caller=main.go:561 level=info build_context="(go=go1.19.5, platform=linux/amd64, user=root@c67d48967507, date=20230201-07:53:32)"ts=2023-02-23T14:32:10.321Z caller=main.go:562 level=info host_details="(Linux 5.15.0-53-generic #59-Ubuntu SMP Mon Oct 17 18:53:30 UTC 2022 x86_64 scw-friendly-franklin (none))"ts=2023-02-23T14:32:10.321Z caller=main.go:563 level=info fd_limits="(soft=1048576, hard=1048576)"ts=2023-02-23T14:32:10.321Z caller=main.go:564 level=info vm_limits="(soft=unlimited, hard=unlimited)"ts=2023-02-23T14:32:10.324Z caller=main.go:993 level=info msg="Starting TSDB ..."ts=2023-02-23T14:32:10.335Z caller=main.go:1017 level=info msg="TSDB started"ts=2023-02-23T14:32:10.335Z caller=main.go:1197 level=info msg="Loading configuration file" filename=/etc/prometheus/prometheus.ymlts=2023-02-23T14:32:10.335Z caller=main.go:1234 level=info msg="Completed loading of configuration file" filename=/etc/prometheus/prometheus.yml totalDuration=532.88µs db_storage=1.132µs remote_storage=1.593µs web_handler=310ns query_engine=521ns scrape=196.599µs scrape_sd=19.537µs notify=962ns notify_sd=1.563µs rules=1.553µs tracing=5.21µsts=2023-02-23T14:32:10.336Z caller=main.go:978 level=info msg="Server is ready to receive web requests." -
Open your browser and type
http://IP.OF.YOUR.SERVER:9090
to access the Prometheus interface. If everything is working, we end the task by pressing onCTRL + C
on our keyboard.Note:If you get an error message when you start the Instance, double check your configuration file for possible YAML syntax errors. The error message will tell you what to check.
-
The Instance is working now, but it cannot yet be launched automatically at boot. To achieve this, we have to create a new
systemd
configuration file that will tell your OS which services should it launch automatically during the boot process.nano /etc/systemd/system/prometheus.serviceThe service file tells
systemd
to run Prometheus asprometheus
and specifies the path of the configuration files. -
Copy the following information in the file and save it, then exit the editor:
[Unit]Description=Prometheus MonitoringWants=network-online.targetAfter=network-online.target[Service]User=prometheusGroup=prometheusType=simpleExecStart=/usr/local/bin/prometheus \--config.file /etc/prometheus/prometheus.yml \--storage.tsdb.path /var/lib/prometheus/ \--web.console.templates=/etc/prometheus/consoles \--web.console.libraries=/etc/prometheus/console_librariesExecReload=/bin/kill -HUP $MAINPID[Install]WantedBy=multi-user.target -
To use the new service, reload
systemd
:systemctl daemon-reloadWe enable the service so that it will be loaded automatically during boot:
systemctl enable prometheus.service -
Start Prometheus:
systemctl start prometheus.service
Your Prometheus Instance is ready to be used.
We have now installed Prometheus to monitor your instance.
Prometheus Web Interface
Prometheus provides a basic web Instance running on http://your.Instance.ip:9090
that provide access to the data collected by the software.
We can verify the status of our Prometheus Instance from the interface:
You can perform queries with the collected data.
The interface we set up is lightweight. The Prometheus team, therefore, recommends using a tool like Grafana if you want to do more than testing and debugging the installation.
Installing Grafana
- Install Grafana on our Instance which queries our Prometheus Instance.
apt-get install -y adduser libfontconfig1wget https://dl.grafana.com/oss/release/grafana_9.3.6_amd64.debdpkg -i grafana_9.3.6_amd64.deb
- Enable the automatic start of Grafana by
systemd
:systemctl daemon-reload && systemctl enable grafana-Instance.service && systemctl start grafana-Instance.service
Grafana is running now, and we can connect to it at http://your.Instance.ip:3000
. The default user and password is admin
/ admin
.
Now you have to create a Prometheus data source:
- Click the cogwheel icon on the sidebar
- Click Data Sources
- Choose Add data source
- Select Prometheus as the data source
- Set the Prometheus Instance URL (in our case: http://localhost:9090/)
- Click Save & test to test the connection and to save the new data source
Your settings should look like this:
You are now ready to create your first dashboard from the information collected by Prometheus. You can also import some dashboards from a collection of shared dashboards
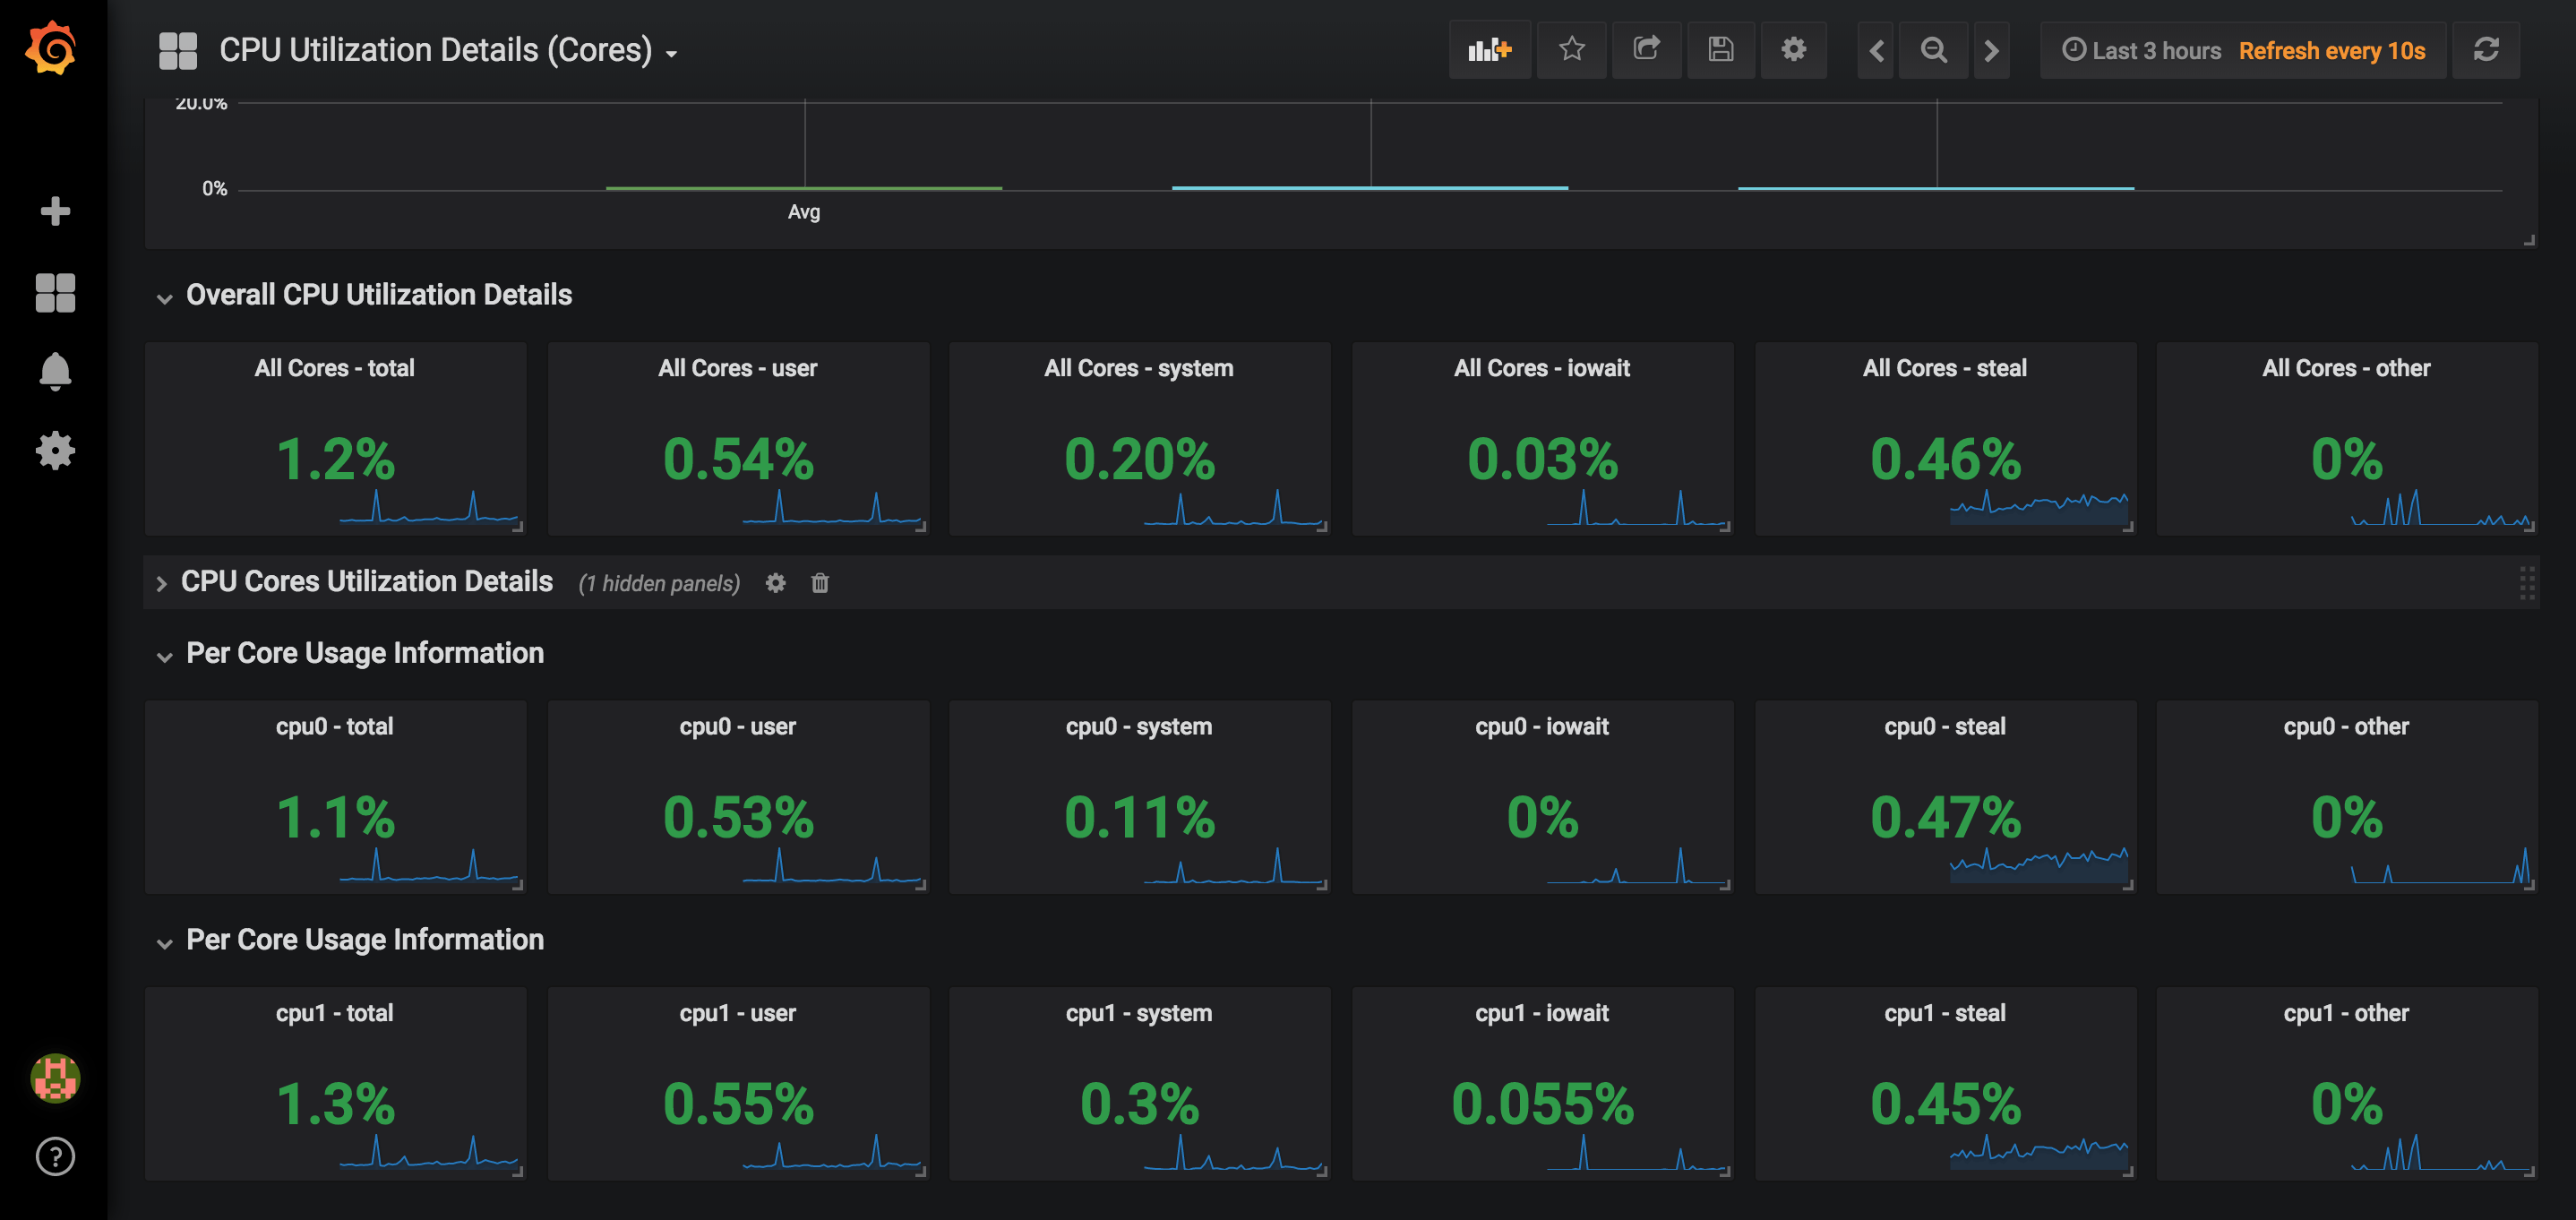
Below is an example of a dashboard that uses the CPU usage of our node and presents it in Grafana: