Monitoring Kubernetes clusters
Before you start
To complete the actions presented below, you must have:
- A Scaleway account logged into the console
- Owner status or IAM permissions allowing you to perform actions in the intended Organization
- Created a Kubernetes Kapsule cluster
- Installed and configured
kubectl, the command line interface for Kubernetes, on your local machine - Installed
helm, the Kubernetes package manager, on your local machine (version 3.2+)
Deploying Prometheus
Deploy the Prometheus stack in a dedicated Kubernetes namespace called monitoring. Set the retention time for 30 days and create a persistent volume (based on Scaleway Block Storage) to store the Prometheus data.
-
Ensure you are connected to your cluster and
kubectlandhelmare installed on your local machine. -
Add the Prometheus Community Helm repo and the stable Kubernetes repo and update them:
helm repo add prometheus-community https://prometheus-community.github.io/helm-charts helm repo add stable https://kubernetes-charts.storage.googleapis.com/ helm repo update -
Use the
helmpackage manager to install the stable release of Prometheus. Set the following parameters tohelmfor both of these:server.persistentVolume: 100Giserver.retention: 30d
helm install prometheus prometheus-community/prometheus --create-namespace --namespace monitoring --set server.persistentVolume.size=100Gi,server.retention=30d NAME: prometheus LAST DEPLOYED: Fri Oct 9 16:35:50 2020 NAMESPACE: monitoring STATUS: DEPLOYED [..] -
Verify that the created pods are all running once the stack is deployed. You can also check whether the 100Gi block volume was created:
kubectl get pods,pv,pvc -n monitoring NAME READY STATUS RESTARTS AGE pod/prometheus-alertmanager-6565668c85-5vdxc 2/2 Running 0 67s pod/prometheus-kube-state-metrics-6756bbbb8-6qs9r 1/1 Running 0 67s pod/prometheus-node-exporter-fbg6s 1/1 Running 0 67s pod/prometheus-pushgateway-6d75c59b7b-6knfd 1/1 Running 0 67s pod/prometheus-server-556dbfdfb5-rx6nl 1/2 Running 0 67s NAME CAPACITY ACCESS MODES RECLAIM POLICY STATUS CLAIM STORAGECLASS REASON AGE persistentvolume/pvc-5a9def3b-22a1-4545-9adb-72823b899c36 100Gi RWO Delete Bound monitoring/prometheus-server scw-bssd 67s persistentvolume/pvc-c5e24d9b-3a69-46c1-9120-b16b7adf73e9 2Gi RWO Delete Bound monitoring/prometheus-alertmanager scw-bssd 67s NAME STATUS VOLUME CAPACITY ACCESS MODES STORAGECLASS AGE persistentvolumeclaim/prometheus-alertmanager Bound pvc-c5e24d9b-3a69-46c1-9120-b16b7adf73e9 2Gi RWO scw-bssd 68s persistentvolumeclaim/prometheus-server Bound pvc-5a9def3b-22a1-4545-9adb-72823b899c36 100Gi RWO scw-bssd 68s -
To access Prometheus use the Kubernetes port forwarding feature:
export POD_NAME=$(kubectl get pods --namespace monitoring -l "app=prometheus,component=server" -o jsonpath="{.items[0].metadata.name}") kubectl --namespace monitoring port-forward $POD_NAME 9090 -
Access the Prometheus dashboard using the following URL: http://localhost:9090
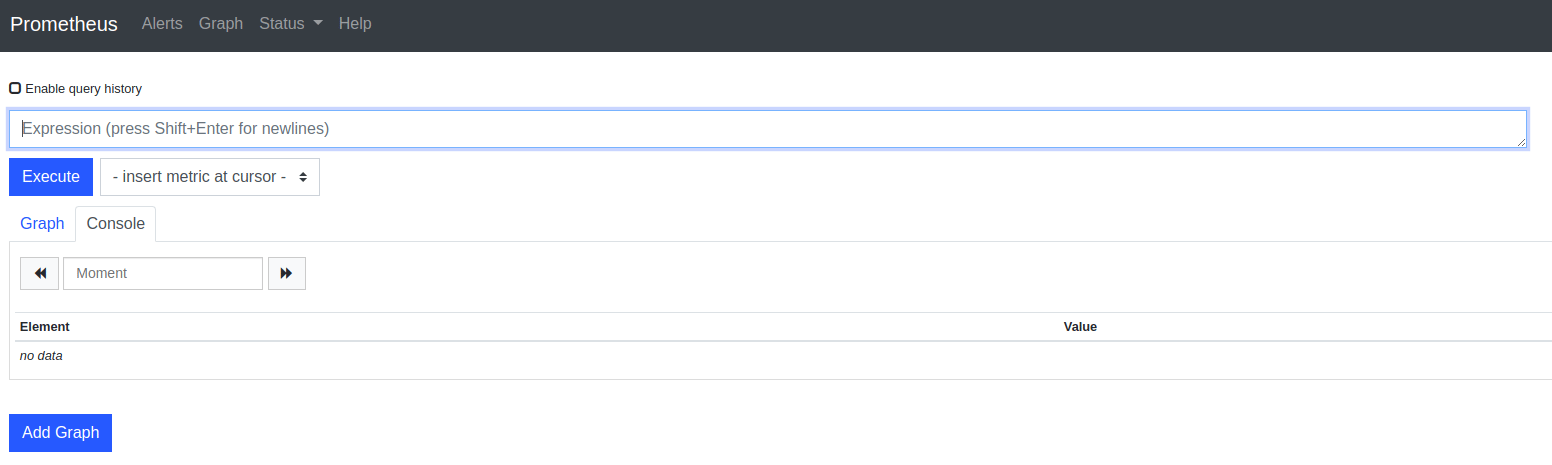
-
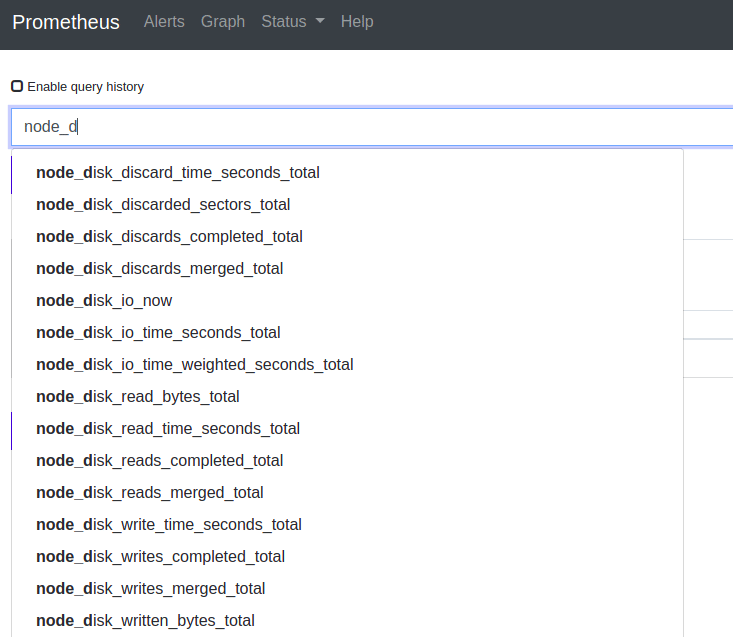
Verify that both
node-exporterandkube-state-metricsmetrics are correctly scrapped by Prometheus:- The
node-exportermetrics begin with “node_”
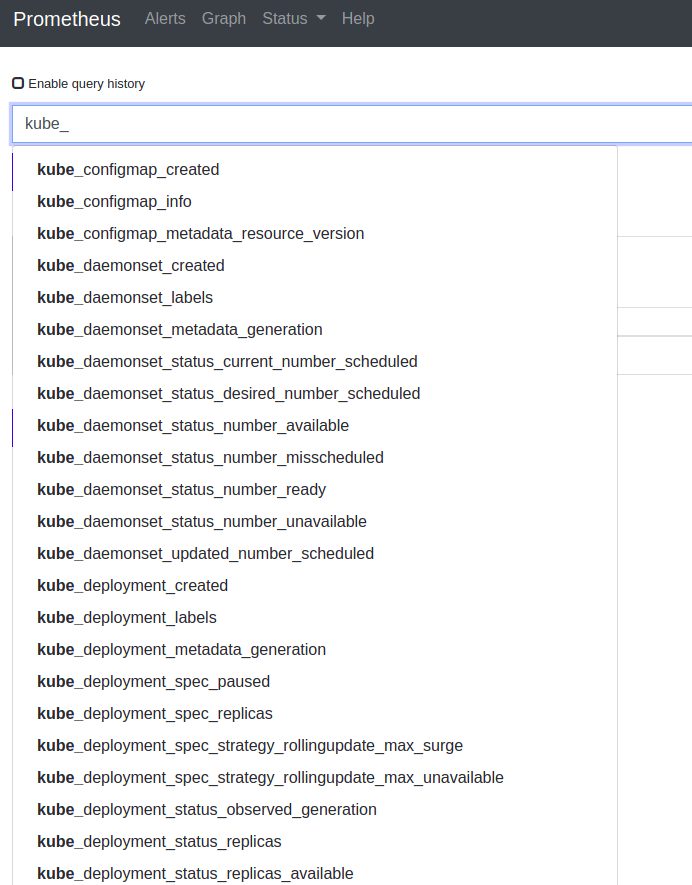
- The
kube-state-metricsbegin with “kube_”
- The
-
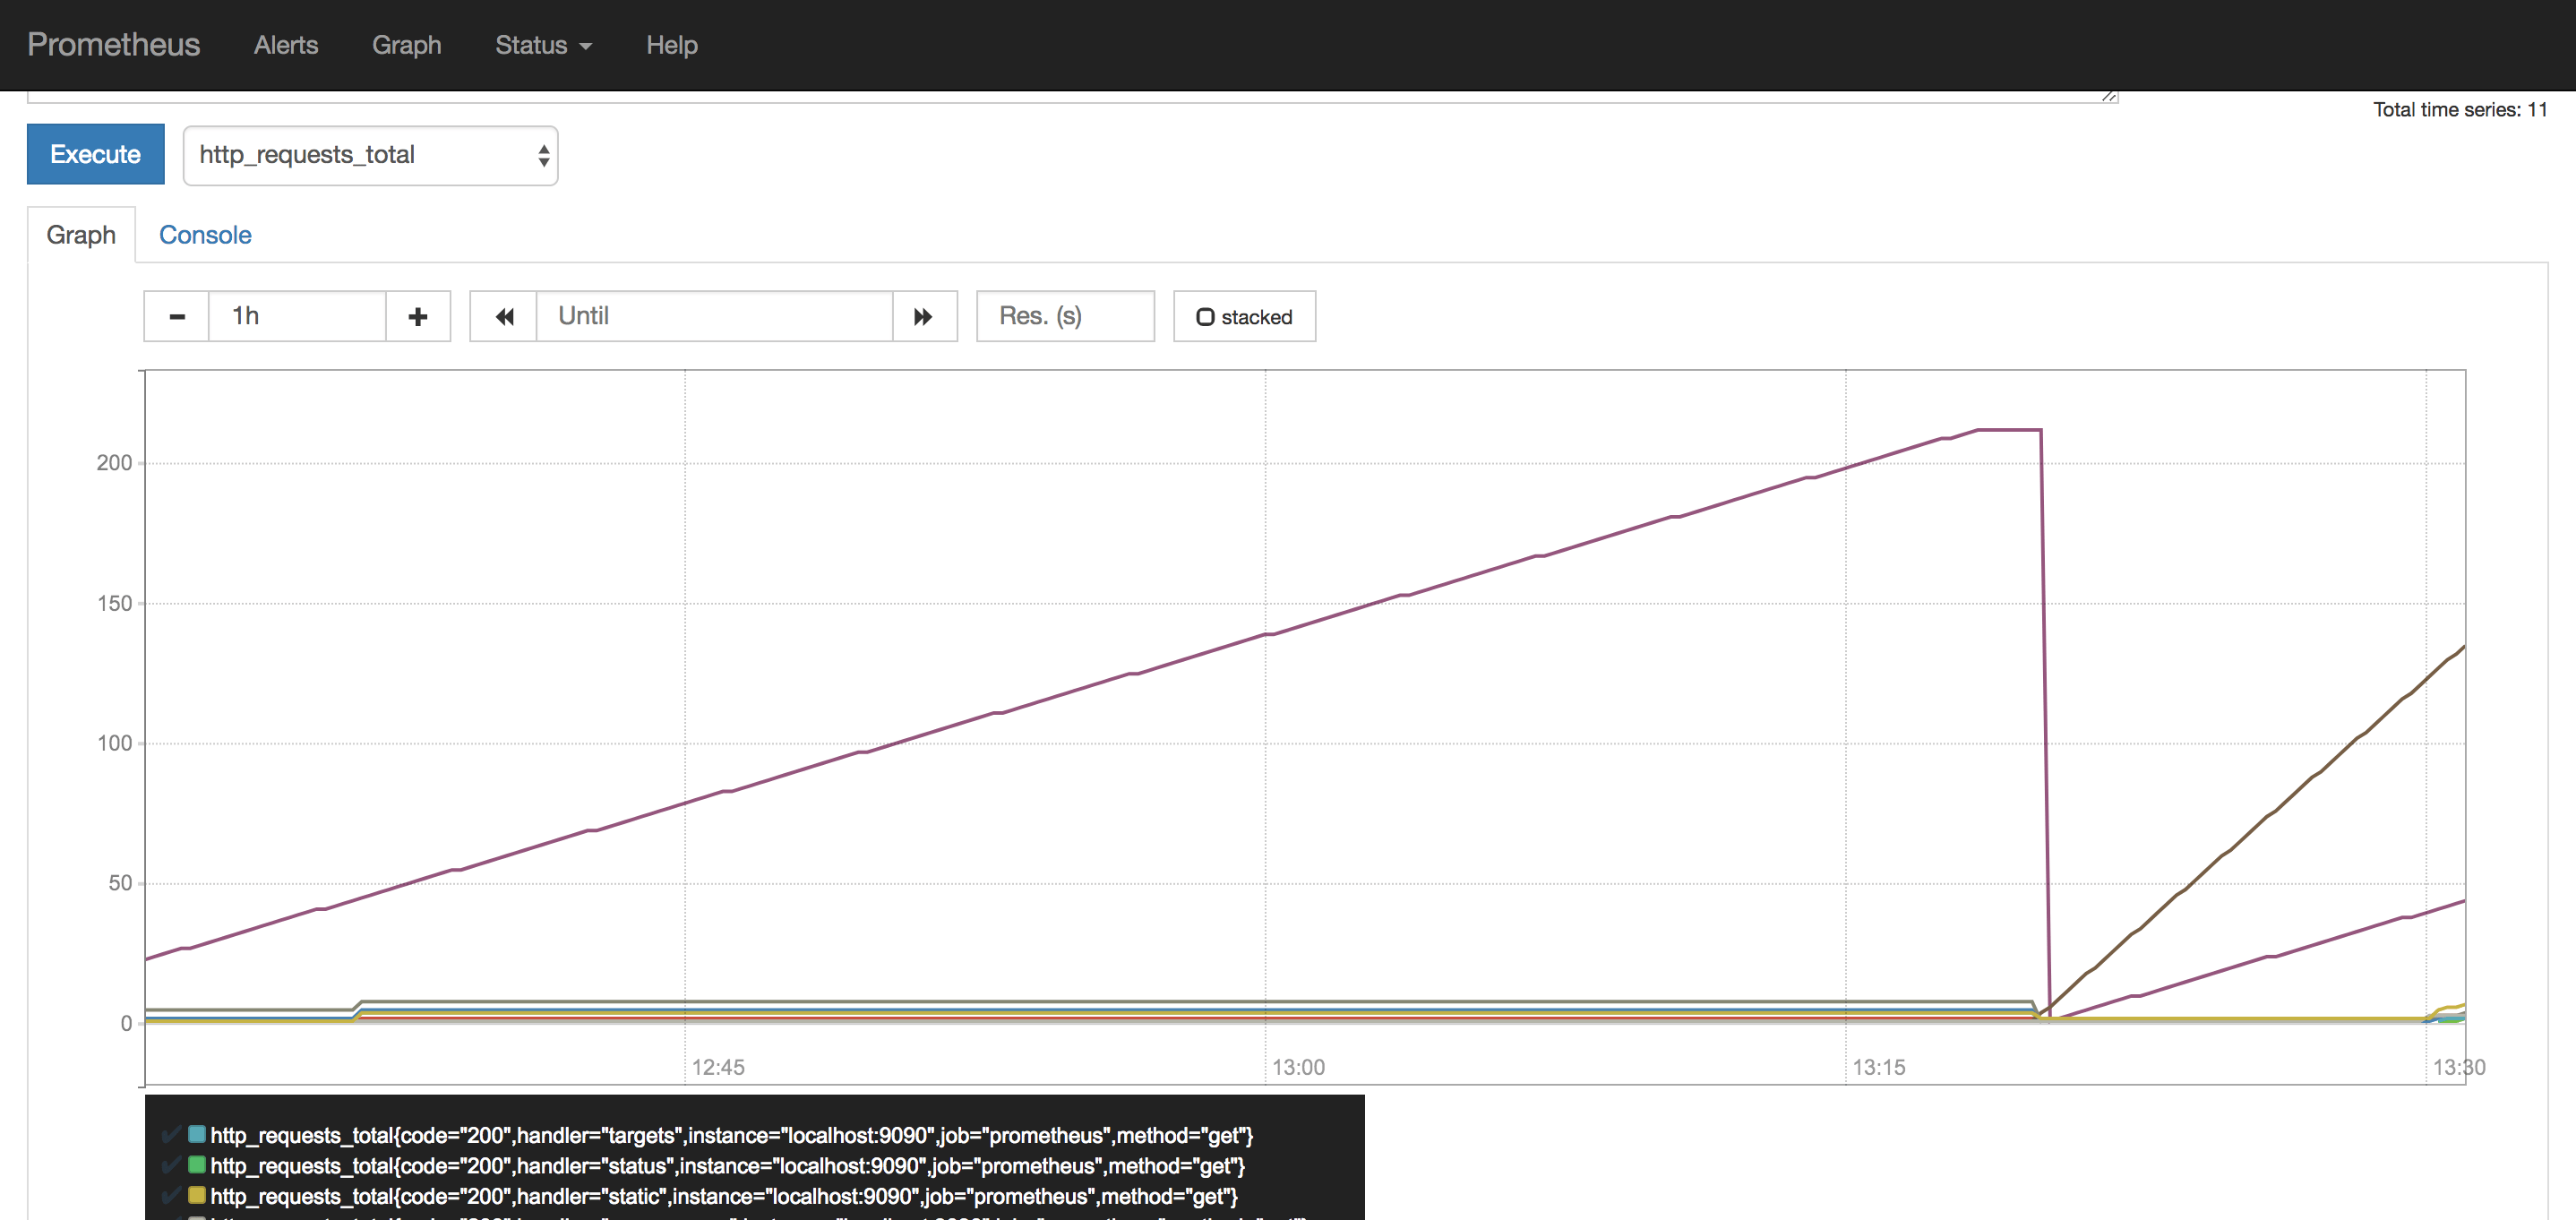
Prometheus is capable of generating graphs on its own. You can test the feature by choosing metrics to analyze directly in the application:
Deploying Grafana
Deploy Grafana to display the Prometheus metrics in some pre-defined dashboards. Deploy it in the monitoring namespace and enable the persistence:
persistence.enable: truepersistence.type: pvcpersistence.size: 10Gi
-
Run the following command to add the Helm repository and install Grafana using
helm:helm repo add grafana https://grafana.github.io/helm-charts helm install grafana grafana/grafana \ --set persistence.enabled=true,persistence.type=pvc,persistence.size=10Gi \ --namespace=monitoring -
Retrieve the admin password once Grafana is installed:
kubectl get secret --namespace monitoring grafana -o jsonpath="{.data.admin-password}" | base64 --decode ; echo -
Configure the port forwarding to access the Grafana web interface at this address:
http://localhost:3000kubectl port-forward --namespace monitoring service/grafana 3000:80 Forwarding from 127.0.0.1:3000 -> 3000 Forwarding from [::1]:3000 -> 3000 -
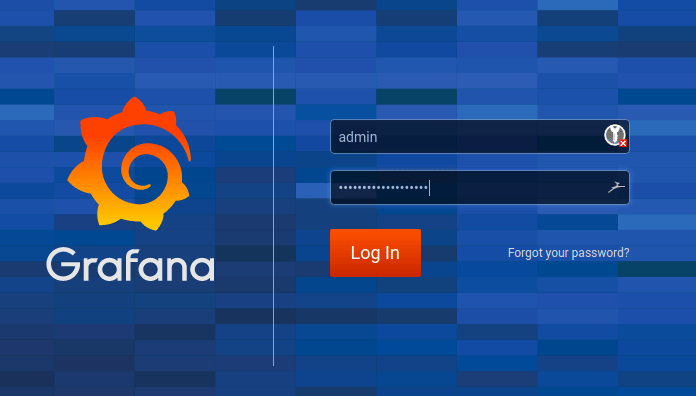
Open the Grafana Web Interface in a web browser at:
http://localhost:3000. The login screen displays. Enter the useradminand the password recovered in step 2: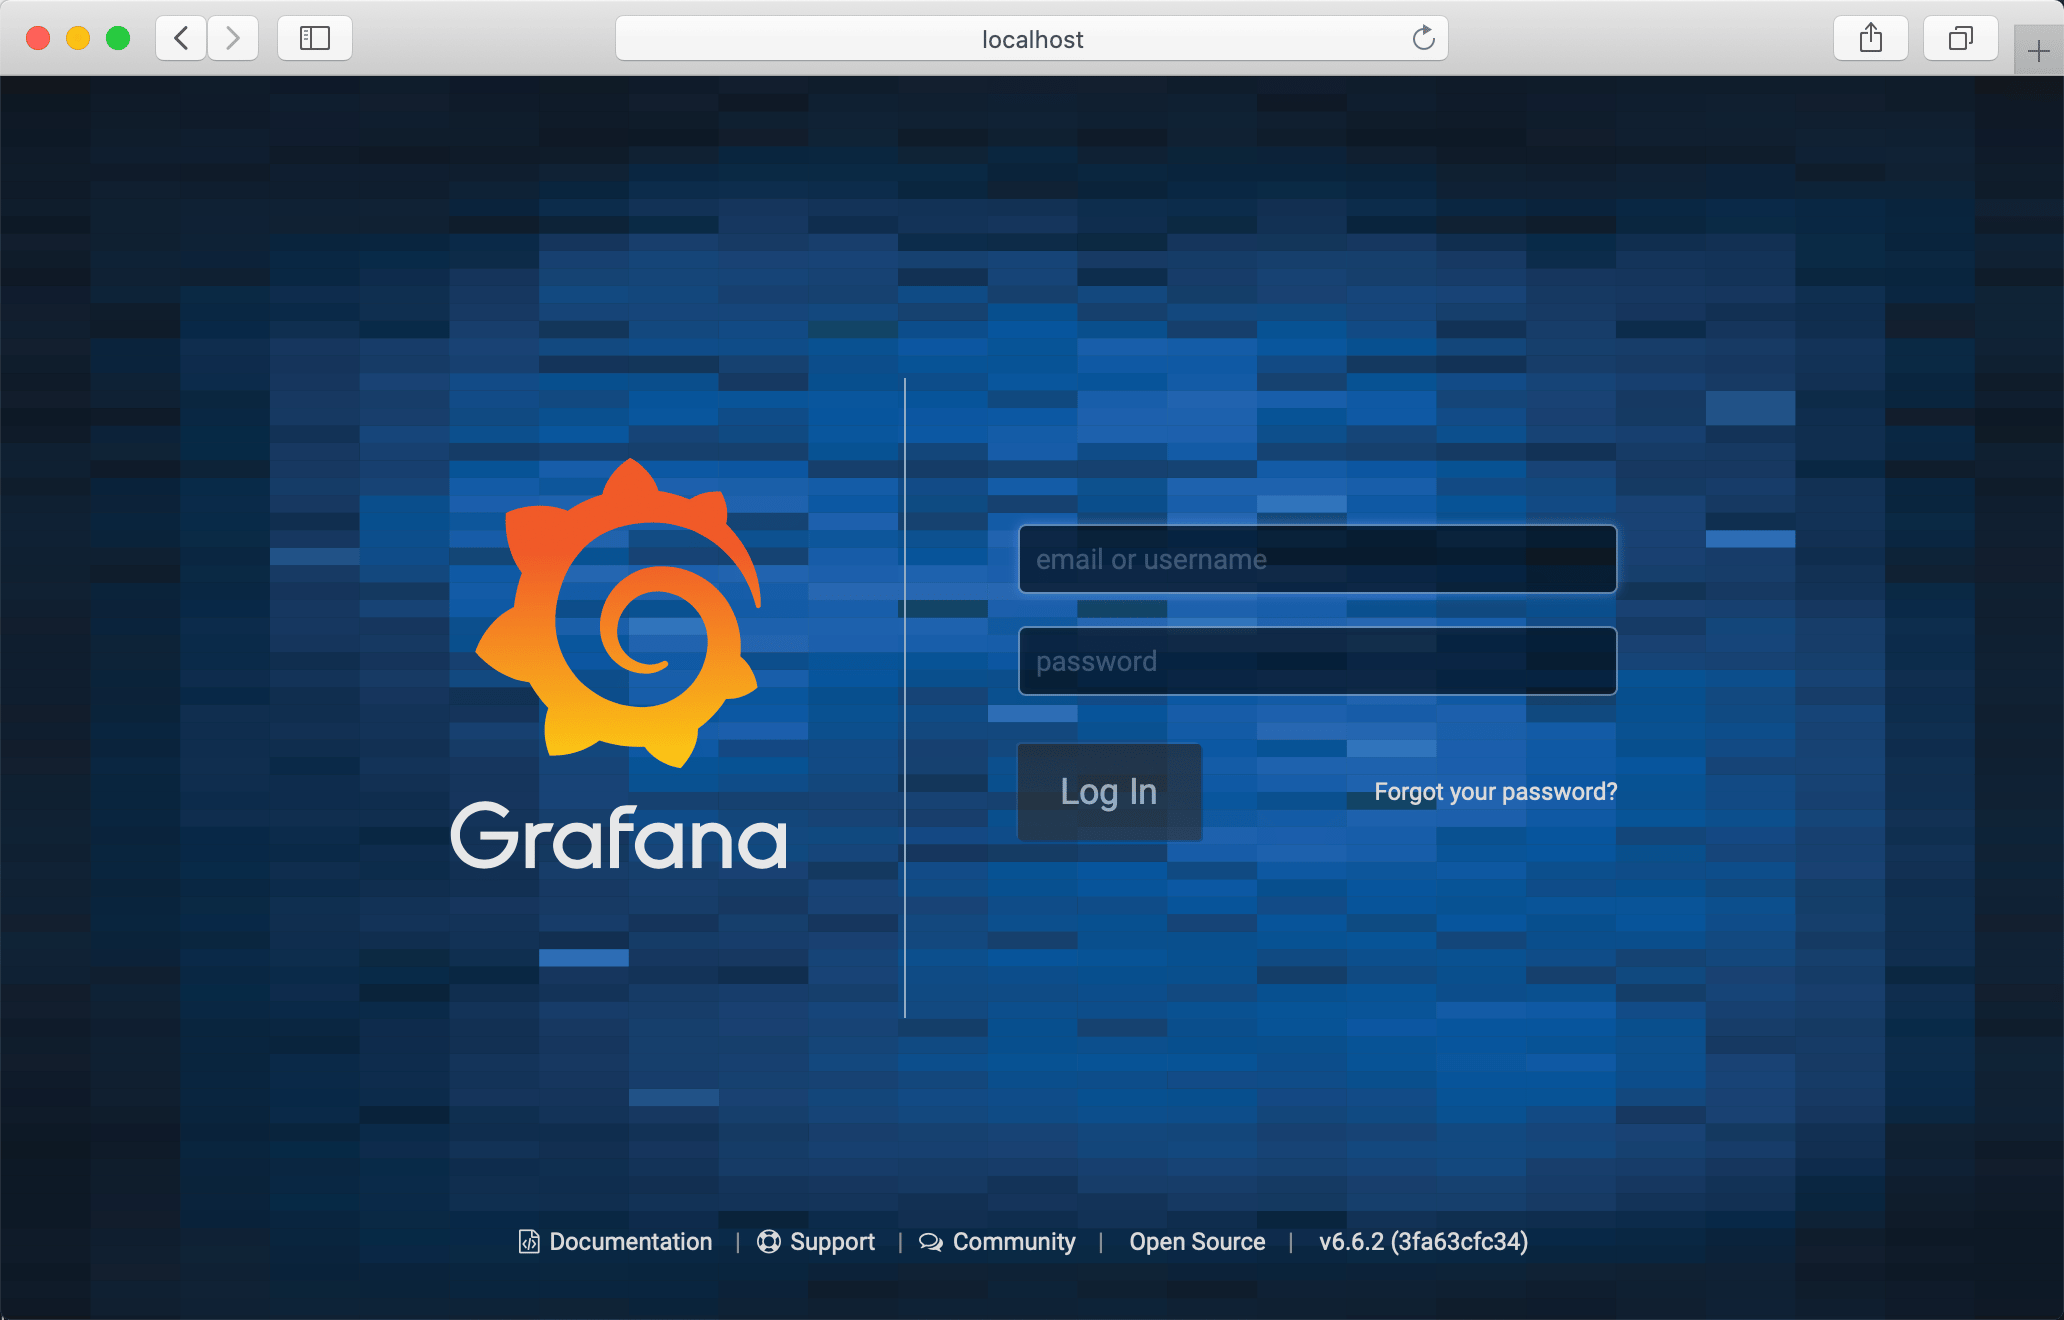
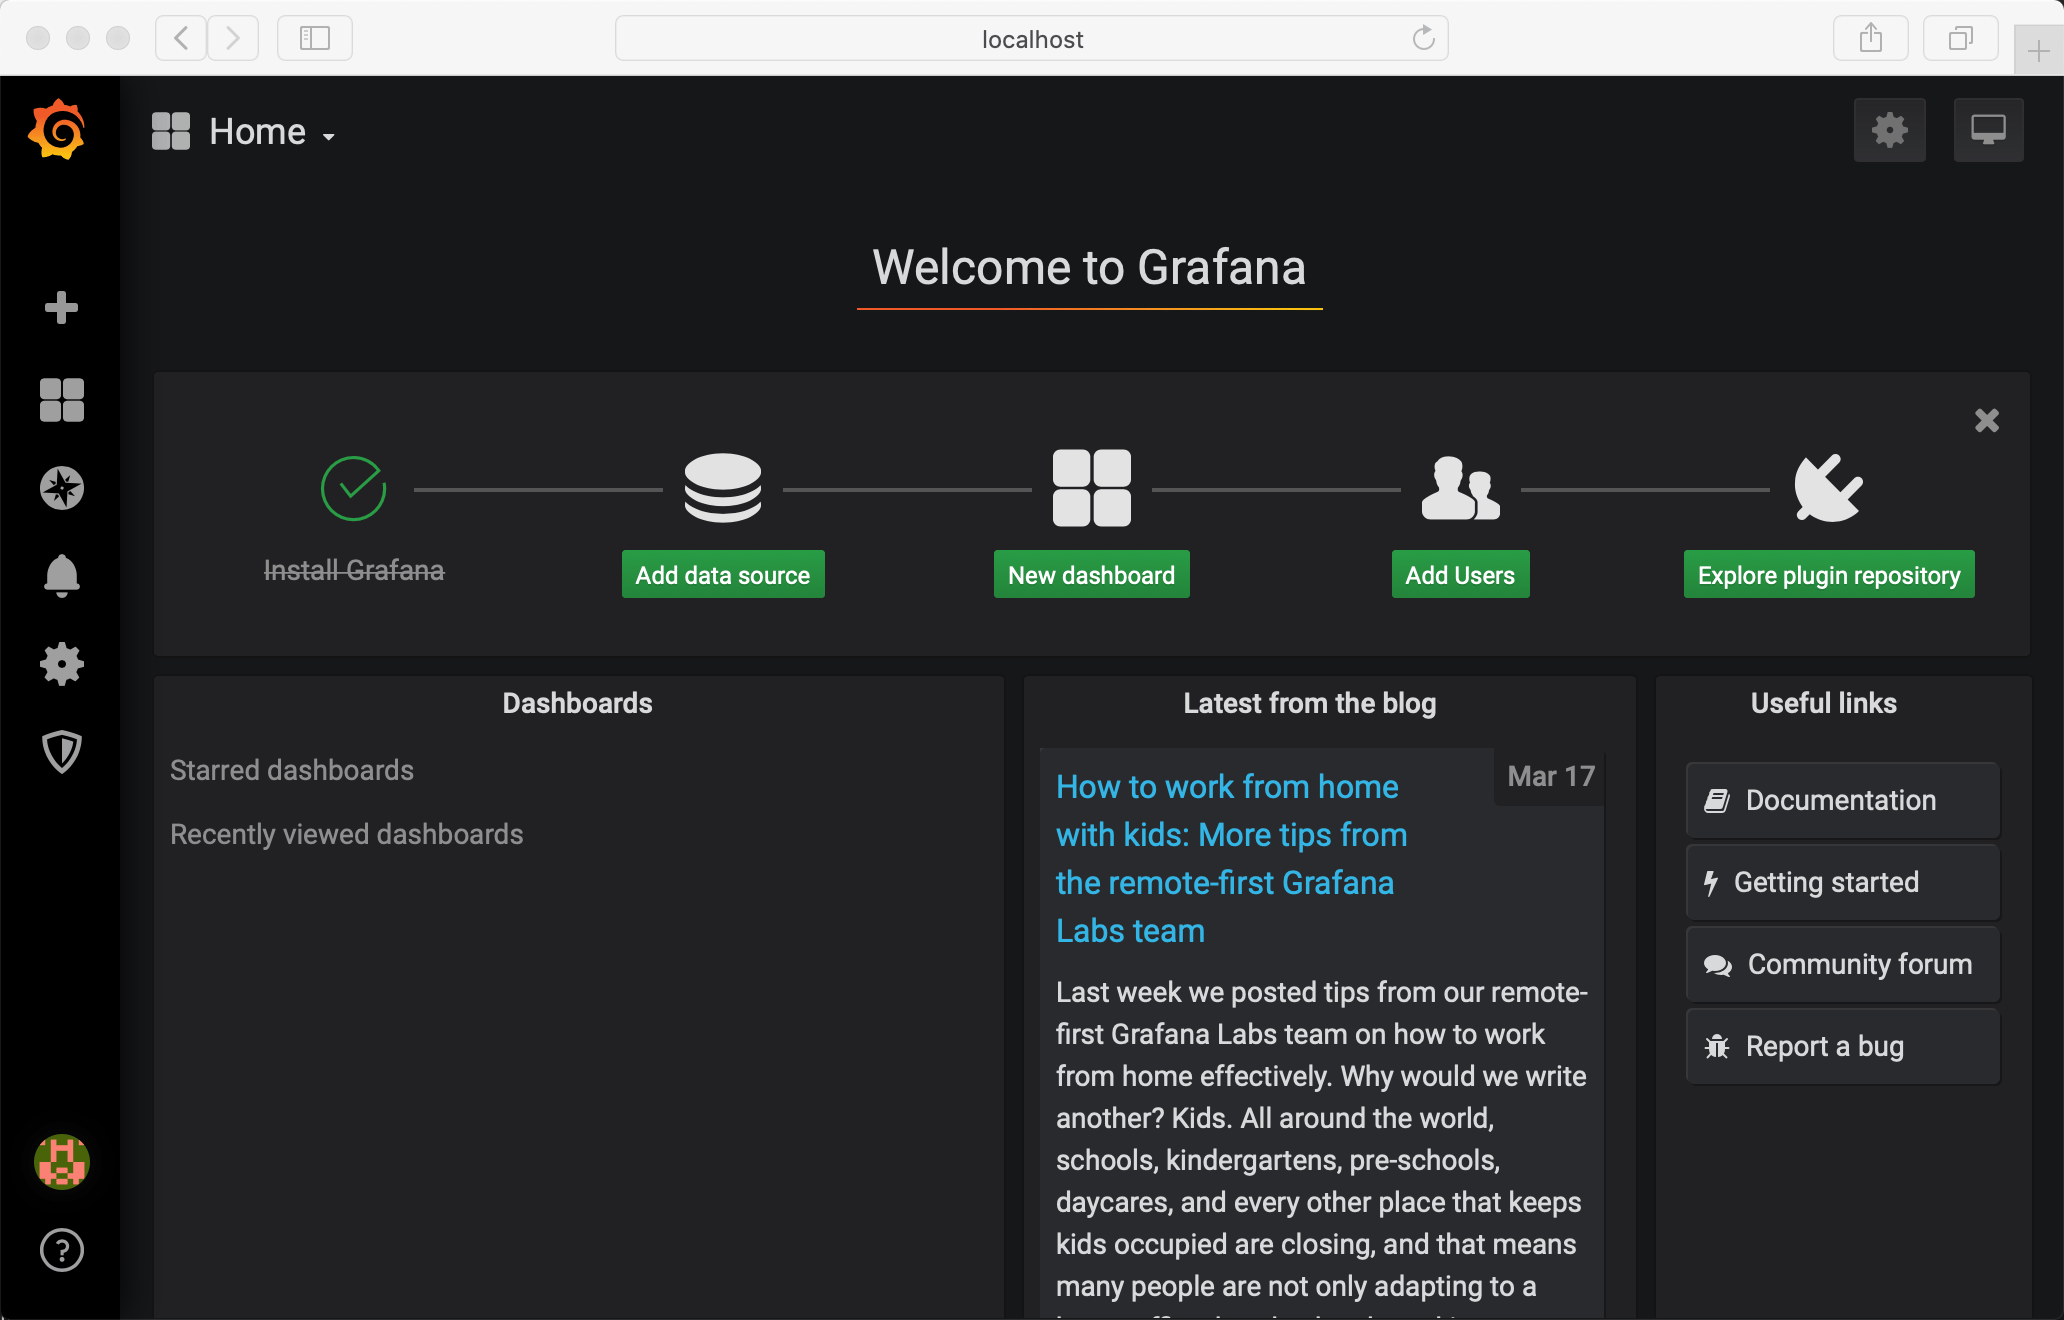
The welcome screen displays and invites you to complete the configuration of Grafana.
-
Click Add data source to configure a new data source:
-
Choose Prometheus as data source from the list of available options.
-
Enter the details of the data source. You can leave the default settings and add the data source:
http://prometheus-server. Click Test & Save to validate the connection to Prometheus and to save the settings: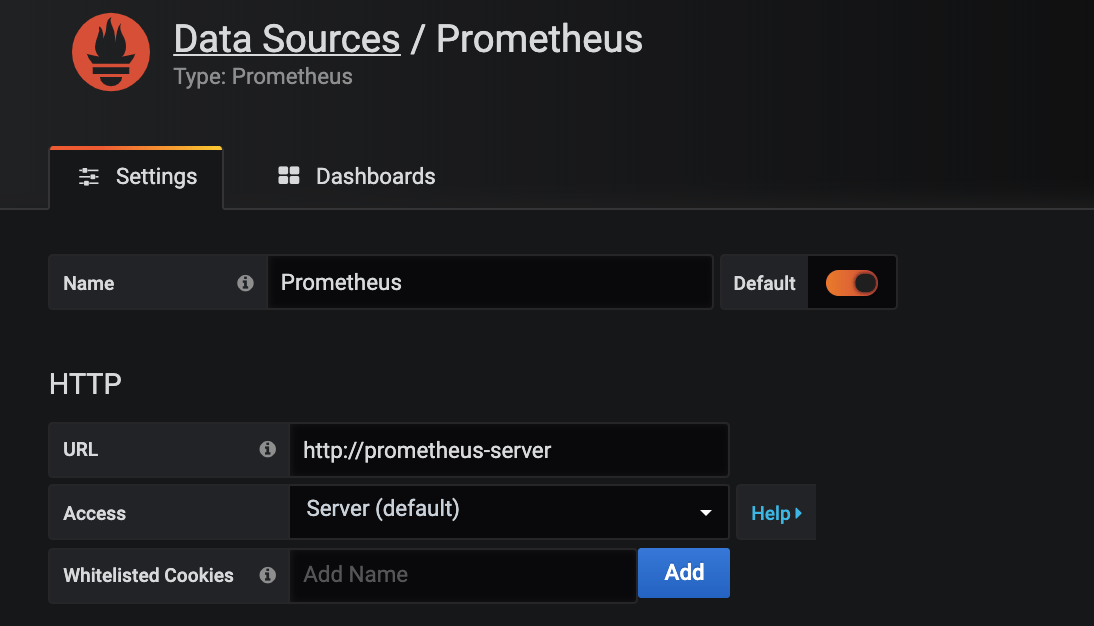
-
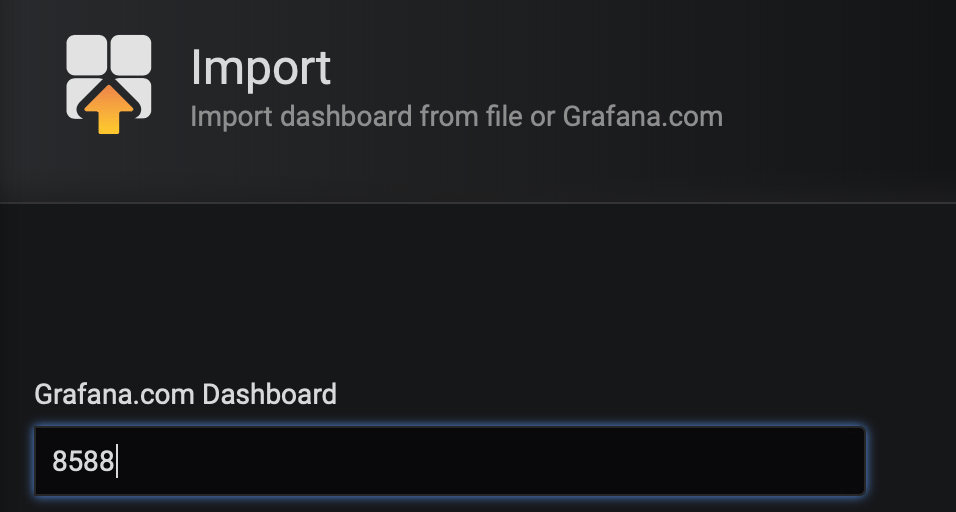
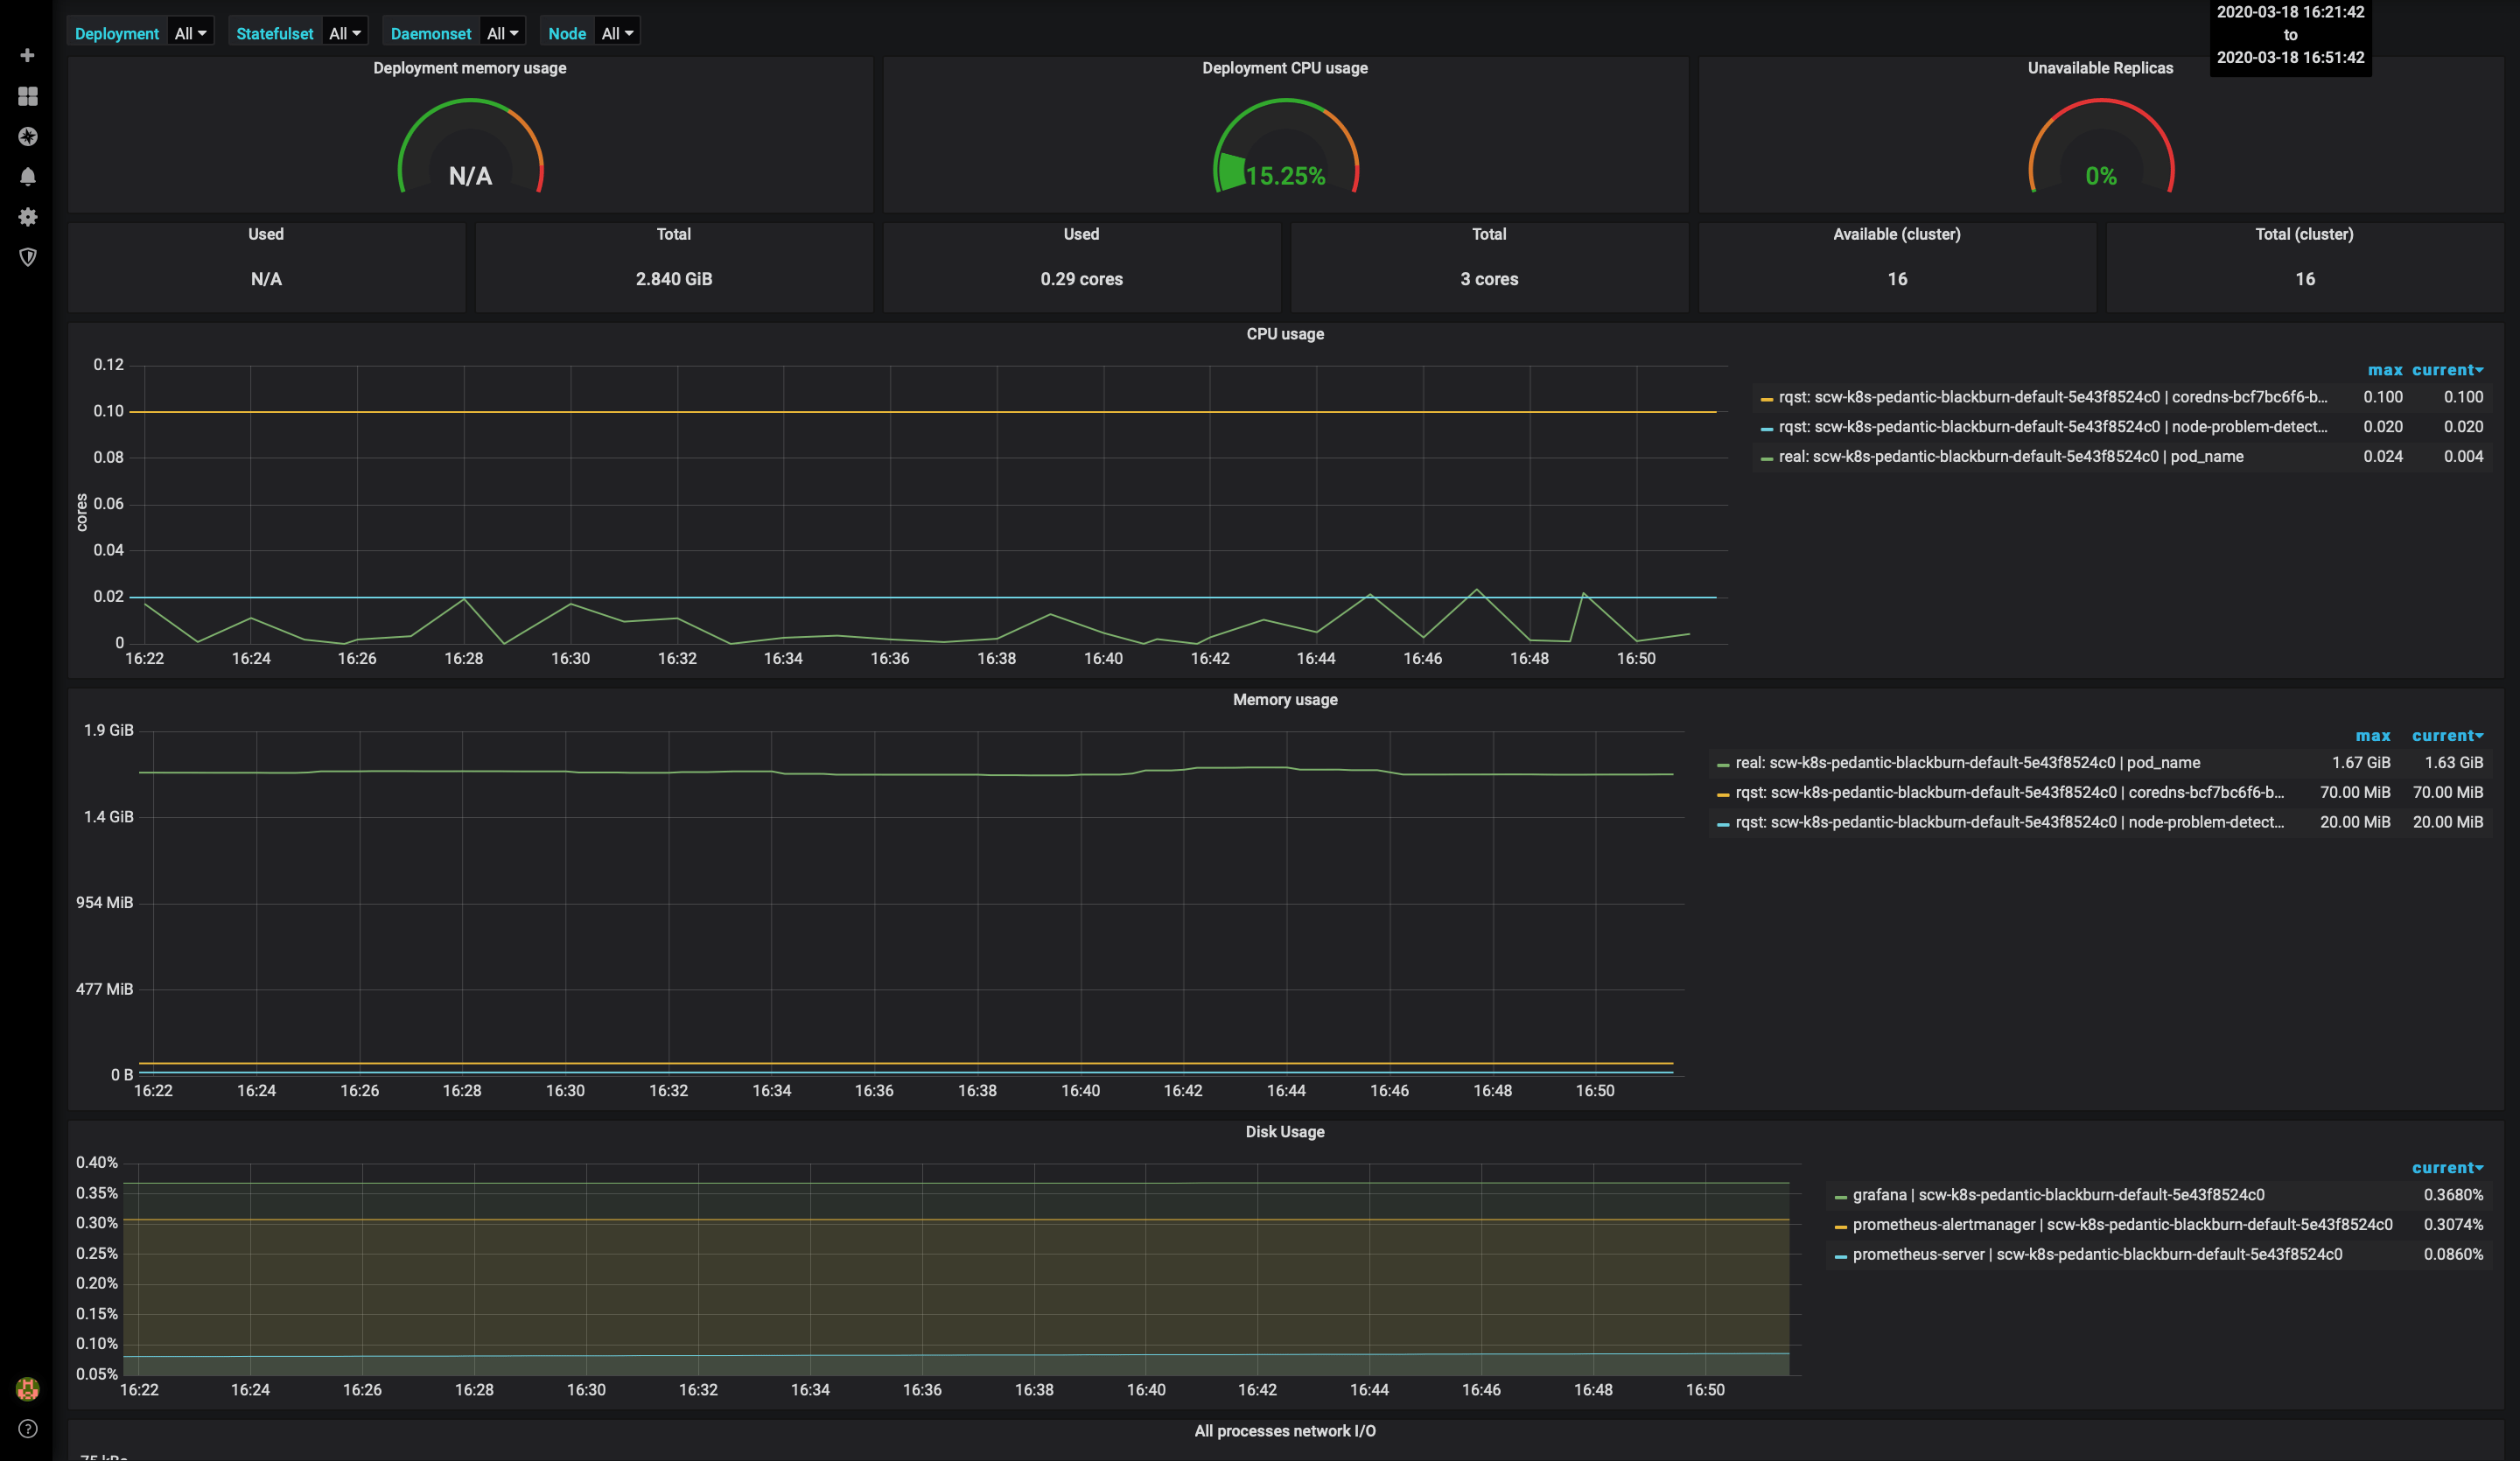
Click + and then Import to import a ready-to-use dashboard from the Grafana website. To create a dashboard that uses kube-state-metrics, import the dashboard number 8588 and get information about your Deployment, StatefulSet and DaemonSet:
-
Choose
Prometheusas data source and click Import.
-
Access the dashboard with metrics for Deployement, StatefulSet and DaemonSet:
-
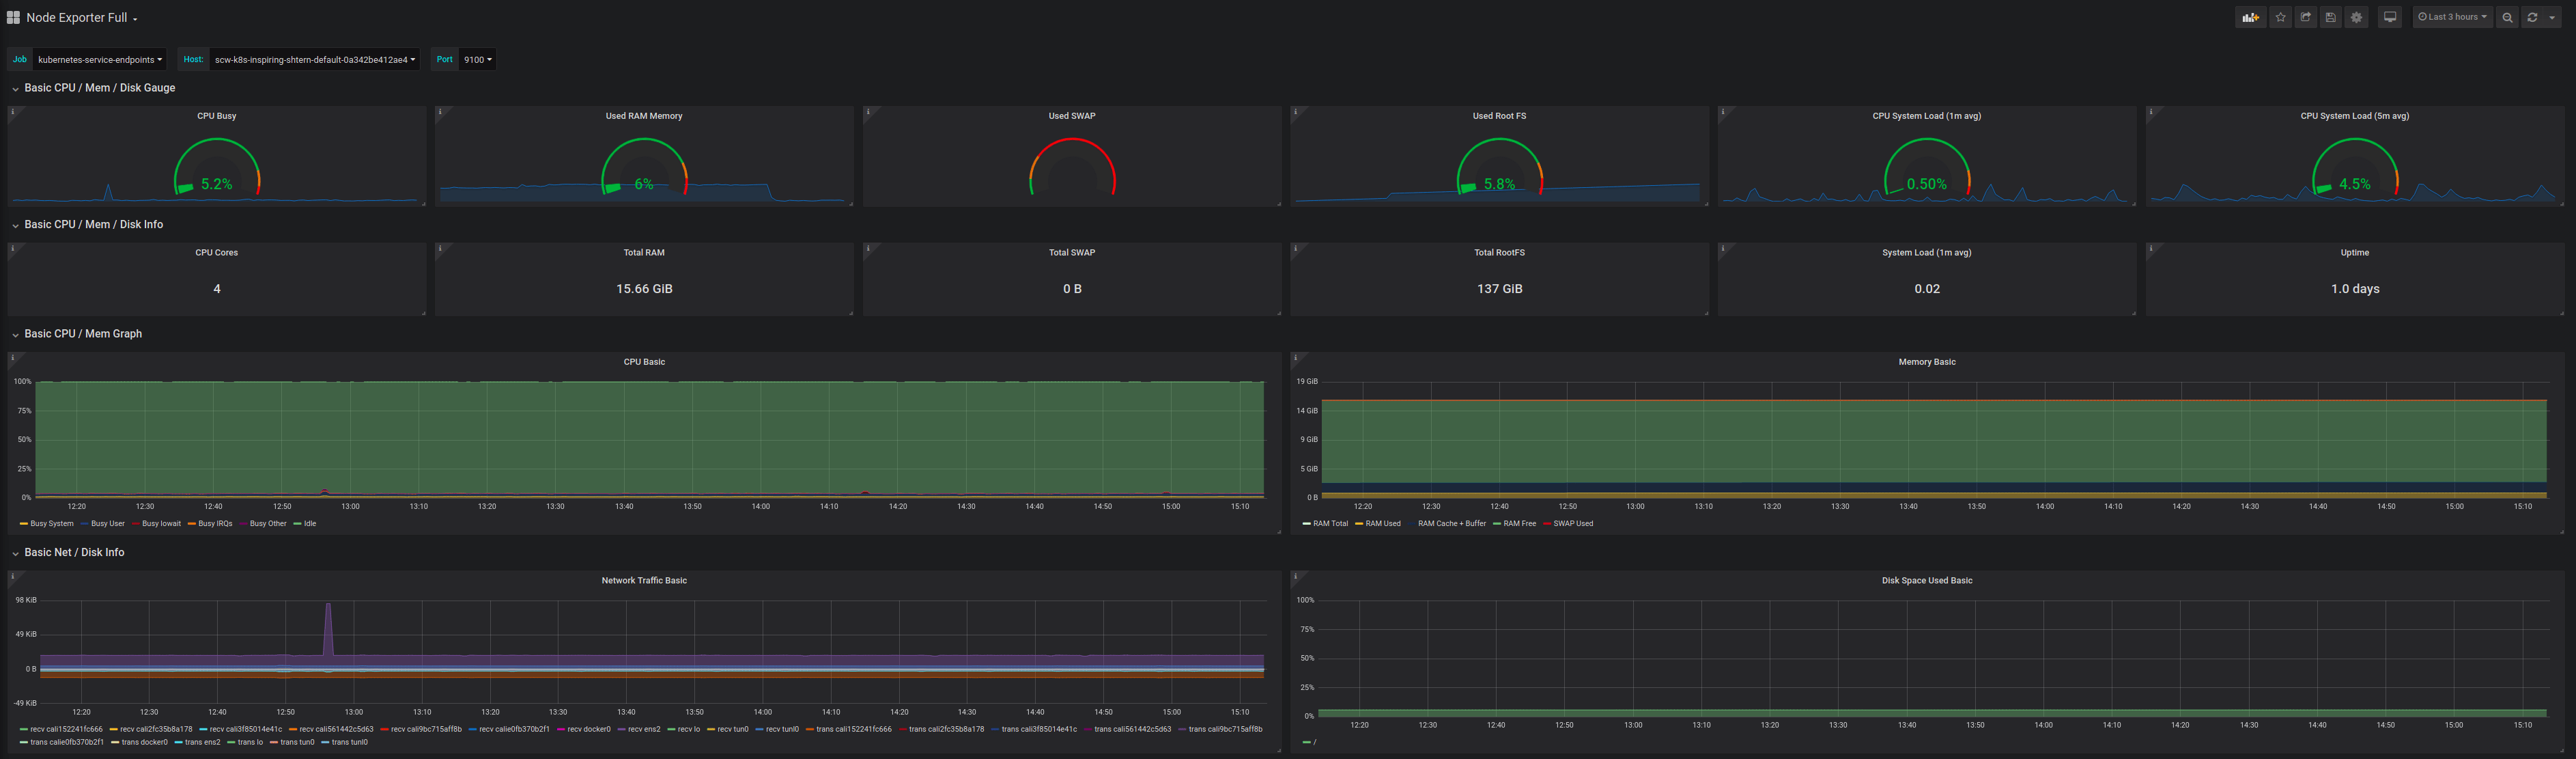
You can also configure additional dashboards, for example, the node exporter full dashboard (1860) to display a dashboard with system metrics for each Kubernetes node:
Deploying Loki
Loki is a log aggregation system inspired by Prometheus.
The loki application is not included in the default Helm repositories.
-
Add the Grafana repository to Helm and update it.
helm repo add grafana https://grafana.github.io/helm-charts
helm repo update
Which returns
"grafana" has been added to your repositories Hang tight while we grab the latest from your chart repositories... ...Successfully got an update from the "loki" chart repository ...Successfully got an update from the "grafana" chart repository Update Complete. ⎈Happy Helming!⎈ -
Install the
loki-stackwith Helm. Install all the stack in a Kubernetes dedicated namespace namedloki-stack. Deploy it to your cluster and enable persistence (allow Helm to create a Scaleway block device and attach it to the Loki pod to store its data) using a Kubernetes Persistent Volumes to survive a pod re-schedule:helm install loki-stack grafana/loki-stack \ --create-namespace \ --namespace loki-stack \ --set promtail.enabled=true,loki.persistence.enabled=true,loki.persistence.size=100GiIt will use Kapsule's default storage class,
scw-bsdd, to create block volumes using Scaleway Block Storage. If you plan to use Loki on a production system, ensure that you set up a retention period to avoid filling the file systems. For instance, use these parameters if you want to enable a 30-day retention (logs older than 30 days will be deleted). Note that you have to choose the size of the persistent volume to fit the amount of volume your deployment will create.config.table_manager.retention_deletes_enabled: trueconfig.table_manager.retention_period: 720h
-
Install Grafana in the loki-stack namespace with Helm. To allow Grafana to survive a re-schedule, enable persistence too:
persistence.enabled: truepersistence.type: pvcpersistence.size: 10Gi
helm install loki-grafana grafana/grafana \ --set persistence.enabled=true,persistence.type=pvc,persistence.size=10Gi \ --namespace=loki-stack -
Check if the block devices were correctly created by Kubernetes:
kubectl get pv,pvc -n loki-stack NAME CAPACITY ACCESS MODES RECLAIM POLICY STATUS CLAIM STORAGECLASS REASON AGE persistentvolume/pvc-88038939-24a5-4383-abe8-f3aab97b7ce7 10Gi RWO Delete Bound loki-stack/loki-grafana scw-bssd 18s persistentvolume/pvc-c6fce993-a73d-4423-9464-7c10ab009062 100Gi RWO Delete Bound loki-stack/storage-loki-stack-0 scw-bssd 4m30s NAME STATUS VOLUME CAPACITY ACCESS MODES STORAGECLASS AGE persistentvolumeclaim/loki-grafana Bound pvc-88038939-24a5-4383-abe8-f3aab97b7ce7 10Gi RWO scw-bssd 19s persistentvolumeclaim/storage-loki-stack-0 Bound pvc-c6fce993-a73d-4423-9464-7c10ab009062 100Gi RWO scw-bssd 5m3s -
Now that both Loki and Grafana are installed in the cluster, check if the pods are correctly running:
kubectl get pods -n loki-stack NAME READY STATUS RESTARTS AGE loki-grafana-67994589cc-7jq4t 0/1 Running 0 74s loki-stack-0 1/1 Running 0 5m58s loki-stack-promtail-dtf5v 1/1 Running 0 5m42s -
To be able to connect to Grafana get the admin password:
kubectl get secret --namespace loki-stack loki-grafana -o jsonpath="{.data.admin-password}" | base64 --decode ; echo -
Configure a
port-forwardto reach Grafana from your web browser:kubectl port-forward --namespace loki-stack service/loki-grafana 3000:80 Forwarding from 127.0.0.1:3000 -> 3000 Forwarding from [::1]:3000 -> 3000 -
Access http://localhost:3000 to reach the Grafana interface. Log in using the admin user and the password you got above.
-
Add the Loki source to Grafana (
http://loki-stack.loki-stack:3100).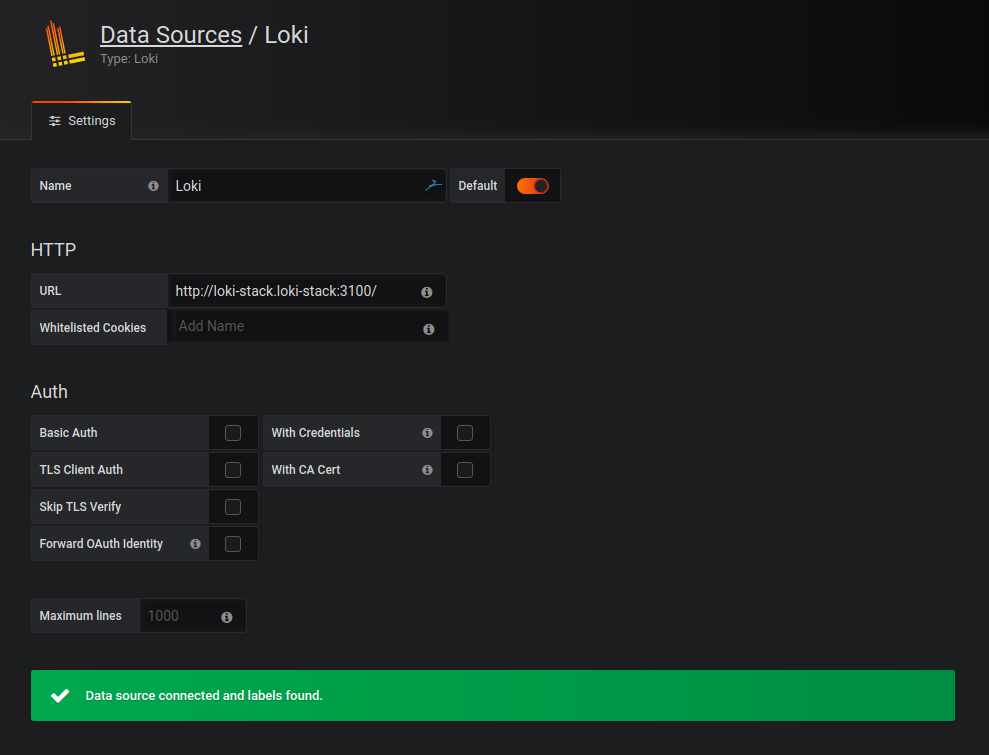
-
Check you can access your logs using the explore tab in Grafana:
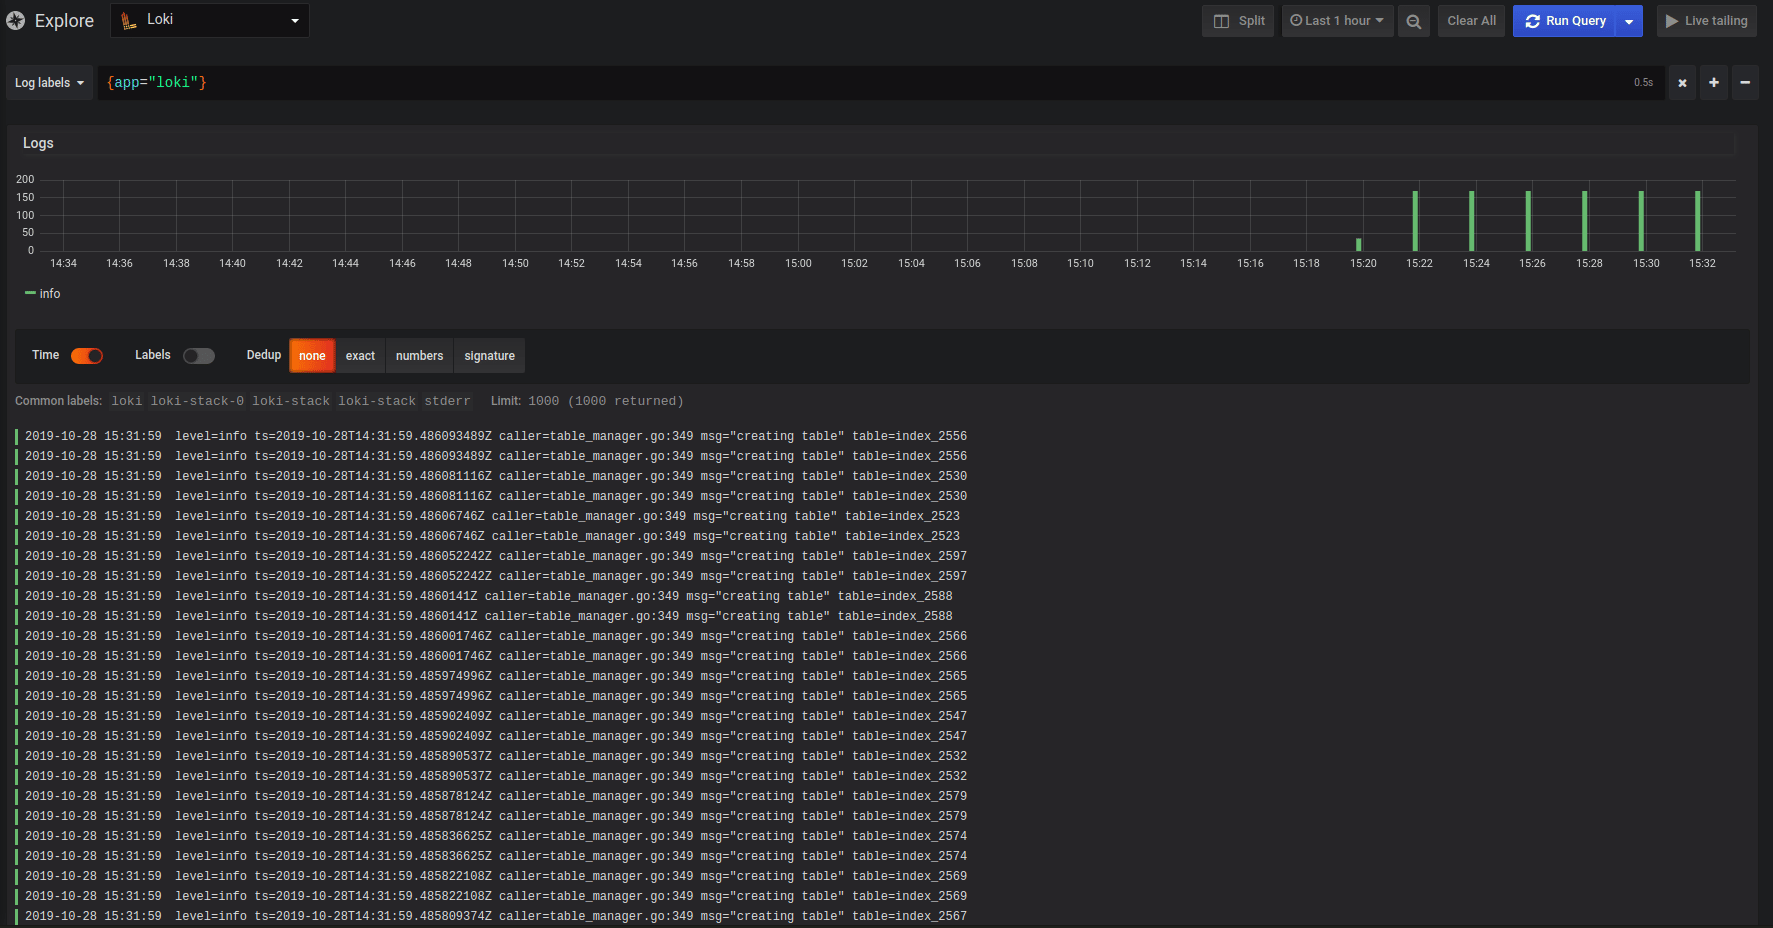
You now have a Loki stack up and running. All your pods’ logs will be stored in Loki and you will be able to view and query your applications’ logs in Grafana. Refer to the Loki documentation, if you want to learn more about querying the Loki data source.