How to monitor your Kubernetes Kapsule cluster with Cockpit
Scaleway's observability Cockpit provides automated monitoring of your Kubernetes cluster. As Kubernetes environments grow in complexity, monitoring becomes crucial for optimal performance. Visualization of the clusters' metrics is available in a hosted Grafana.
Grafana's rich visualizations and ease of use make it an ideal choice. Cockpit offers a hassle-free solution, providing real-time insights without extra infrastructure.
Cockpit empowers you to monitor the clusters' control plane, nodes, managed resources and the cluster system applications.
- Detect incidents and diagnose failures in the earliest stages
- Get new insights on control plane and worker nodes usage such as CPU and memory to optimize your resource allocation
- Achieve a better understanding of your infrastructure by analyzing data on your API server, system applications and up/down scaling behavior
Before you start
To complete the actions presented below, you must have:
- A Scaleway account logged into the console
- Owner status or IAM permissions allowing you to perform actions in the intended Organization
- Created a Kubernetes Kapsule cluster
- Created a Grafana user for Cockpit
How to access your Cockpit Grafana dashboard
- Open your Cockpit in the Scaleway console.
- Click Visualize Scaleway data. The Grafana interface opens in a new browser tab.
- Log into Grafana using your Grafana credentials. The list of your Cockpit dashboards displays.
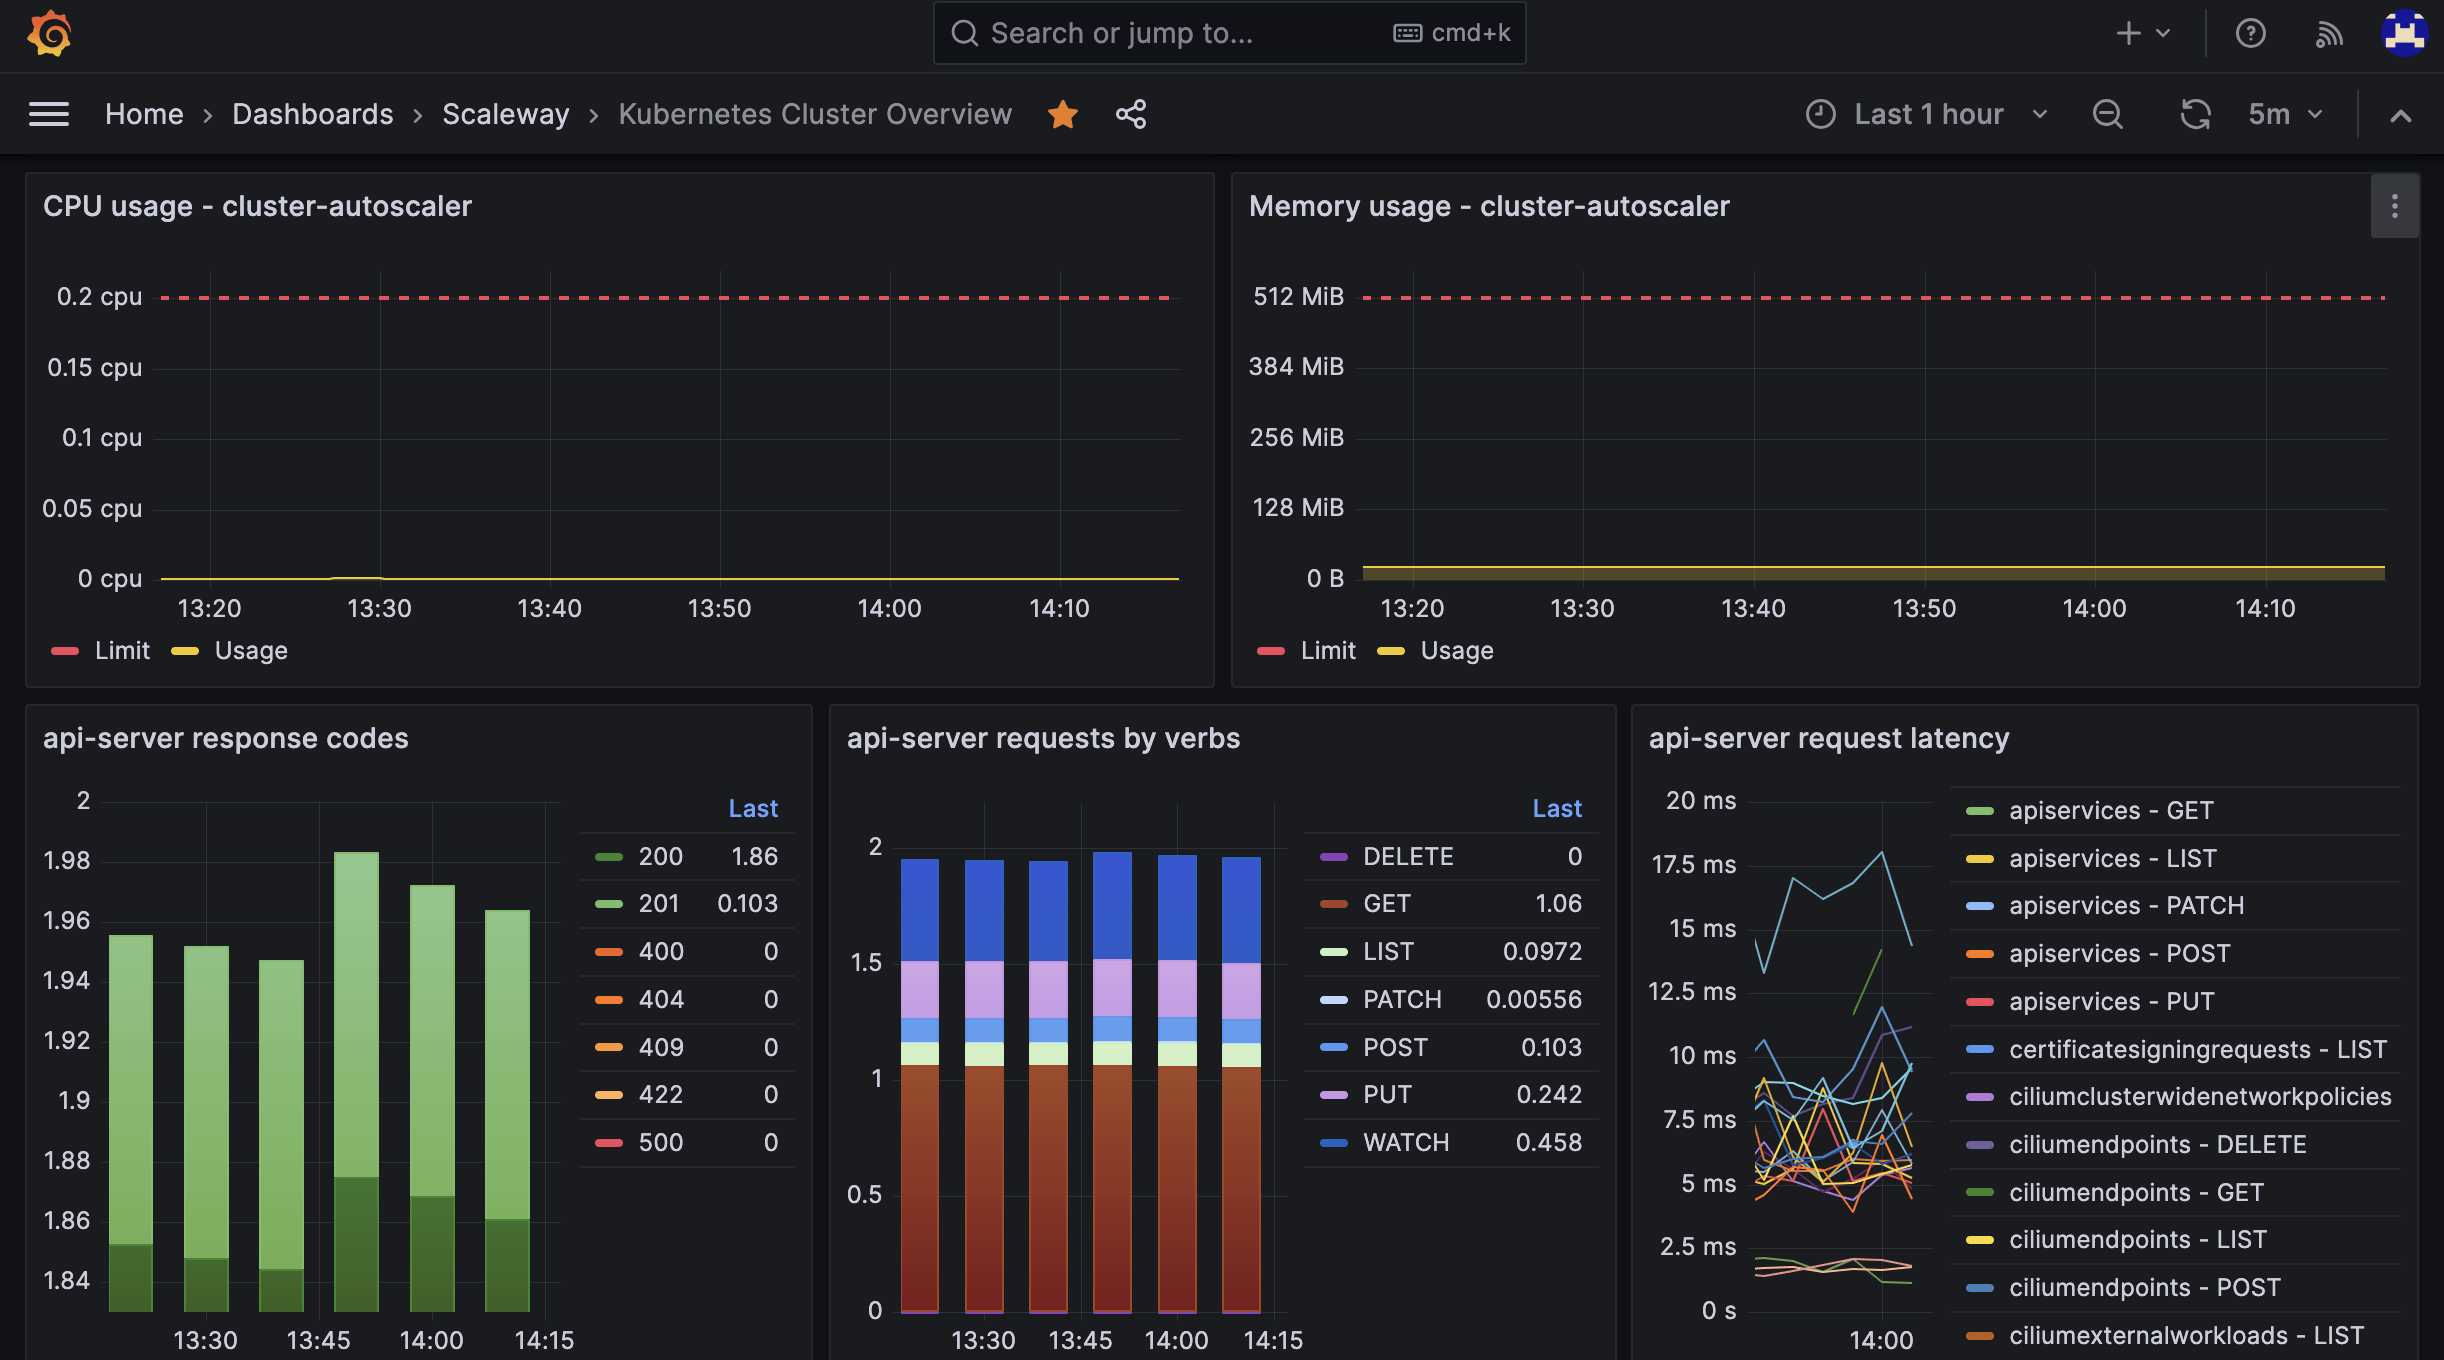
- Click Kubernetes cluster overview in the list of dashboards. A status overview of your cluster displays. This dashboard allows you to monitor multiple components of your Kubernetes cluster: control-plane, nodes, managed resources and cluster system applications.
Monitoring of the kube-apiserver
The cluster overview dashboard offers real-time monitoring capabilities for the kube-apiserver within your Kubernetes cluster. Serving as a crucial component on the control plane, the kube-apiserver acts as the gateway to the Kubernetes API, allowing you to interact with the cluster.
Large clusters with numerous resources (nodes, pods, and custom resources (CRDs)) and high controller requests (e.g. argocd and velero) can cause CPU and memory spikes, leading to sluggish or unresponsive API server performance. You may also encounter errors like "EOF" when using kubectl.
To address this potential issue, it is crucial to monitor the CPU and RAM consumption of the apiserver closely. By doing so, you can proactively manage and reduce the load on the apiserver, thus averting performance bottlenecks.
For scenarios where you require consistent and predictable performance, along with dedicated resources for the apiserver, consider migrating it to a dedicated control plane to ensure optimal performance and stability.
How to view the Kubernetes control plane logs
- Open your Cockpit in the Scaleway console.
- Click Visualize Scaleway data. The Grafana interface opens in a new browser tab.
- Log into Grafana using your Grafana credentials. The list of your Cockpit dashboards displays.
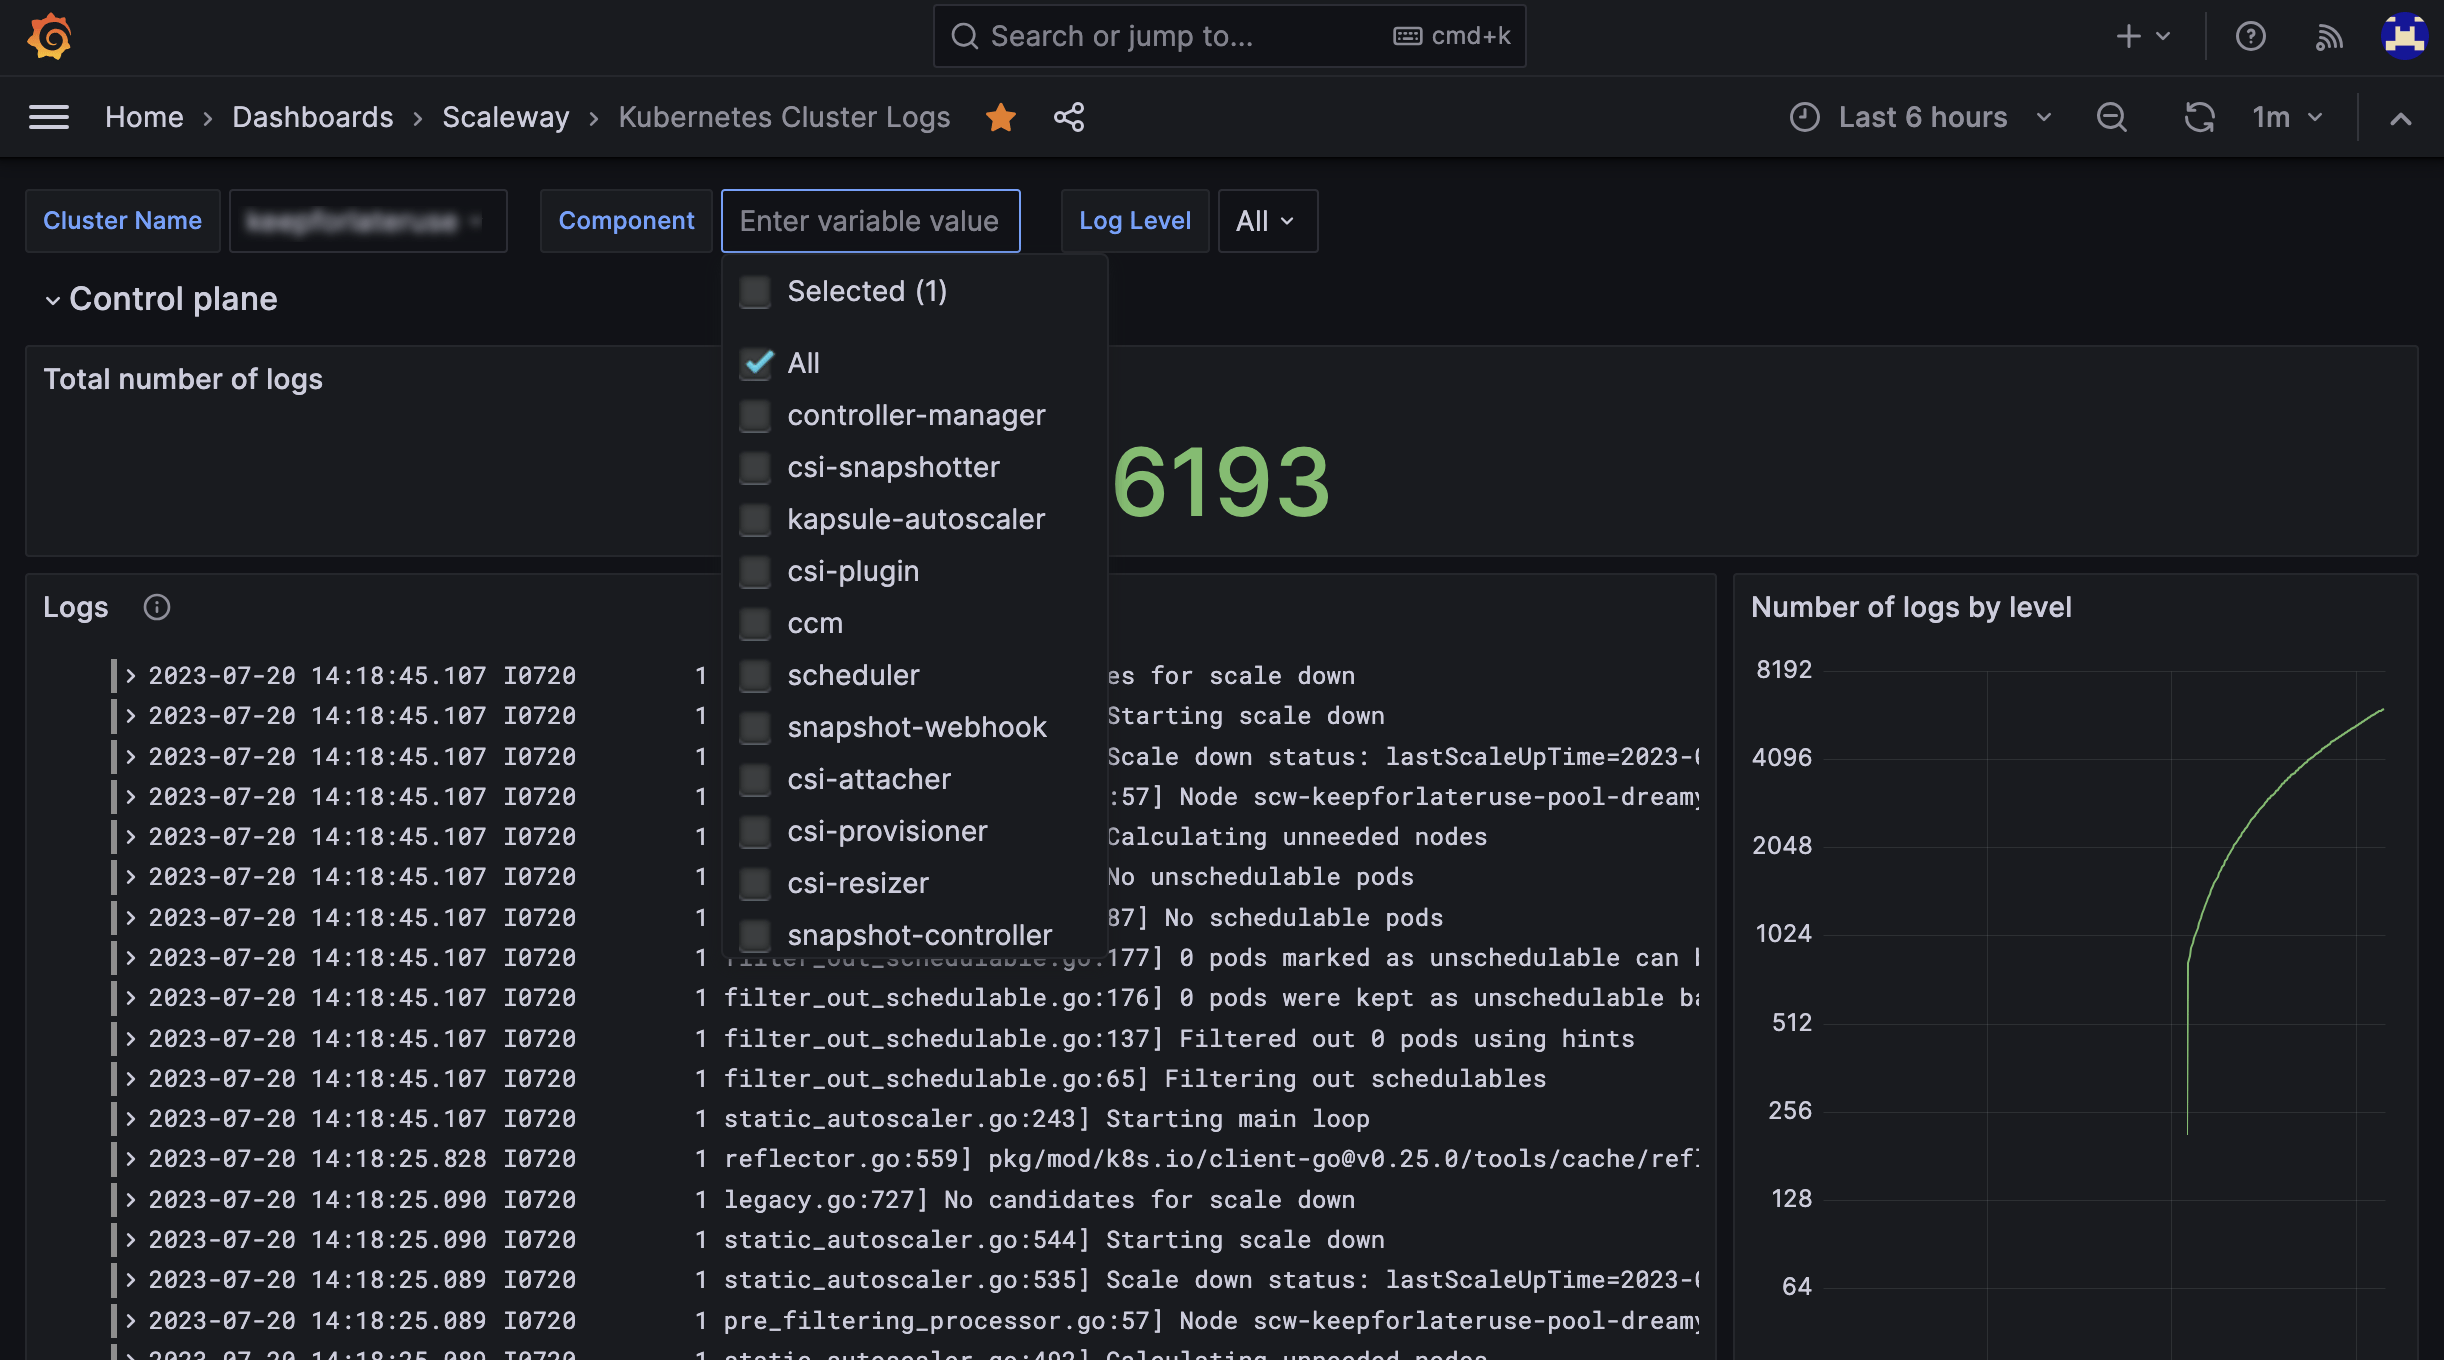
- Click Kubernetes cluster logs in the list of dashboards. A listing of your control plane logs displays. This dashboard allows you to view the logs of multiple components of your Kubernetes cluster, such as the
controller-manager,ccm,kapsule-autoscaler, and more.