How to understand and track your monthly and yearly environmental footprint report
Before you start
To complete the actions presented below, you must have:
- A Scaleway account logged into the console
- Owner status or IAM permissions allowing you to perform actions in the intended Organization
- Environmental data is available only for clients using supported Scaleway products. Data is generated daily and becomes visible the day after product activation.
-
In the Scaleway console, click Environmental Footprint under Cost & Impact Management.
-
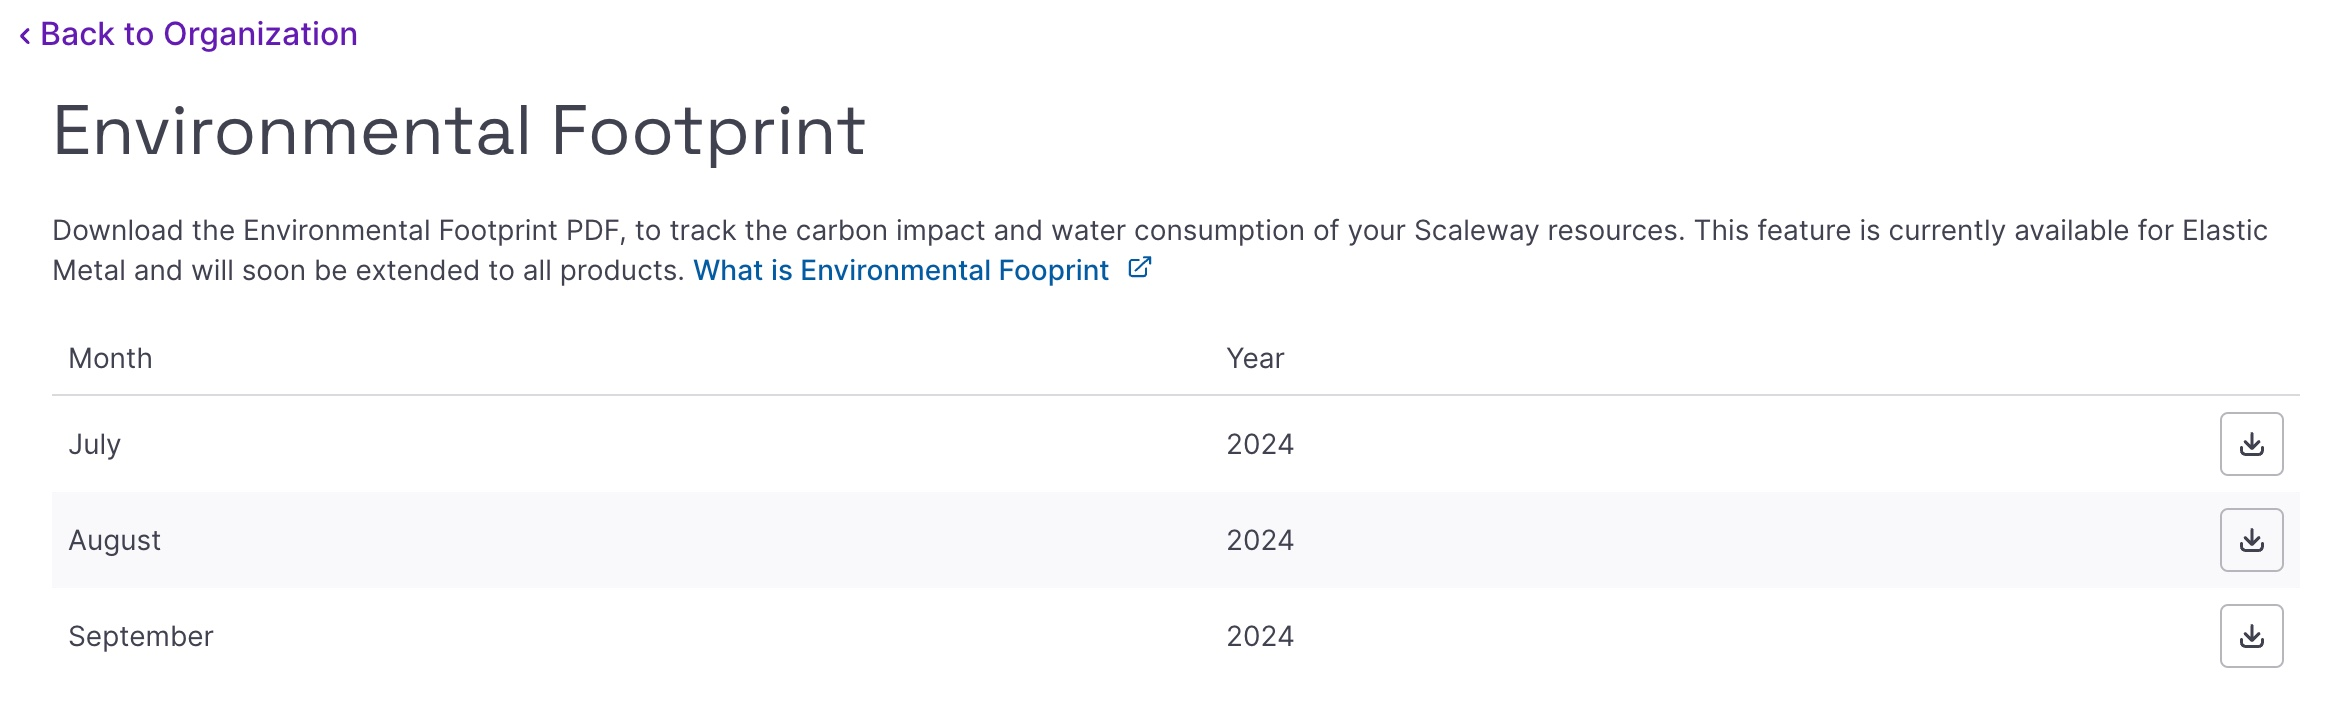
Click on the Reports tab. The Environmental Footprint dashboard appears, with the list of your current and past monthly reports. You can choose between monthly and annual reports by clicking the Monthly / Yearly toggle button.
-
Click download icon next to the report you want to download. The report is downloaded to your local computer in PDF format.
-
Open the PDF file.
-
Read through the document, considering the following elements on the page:
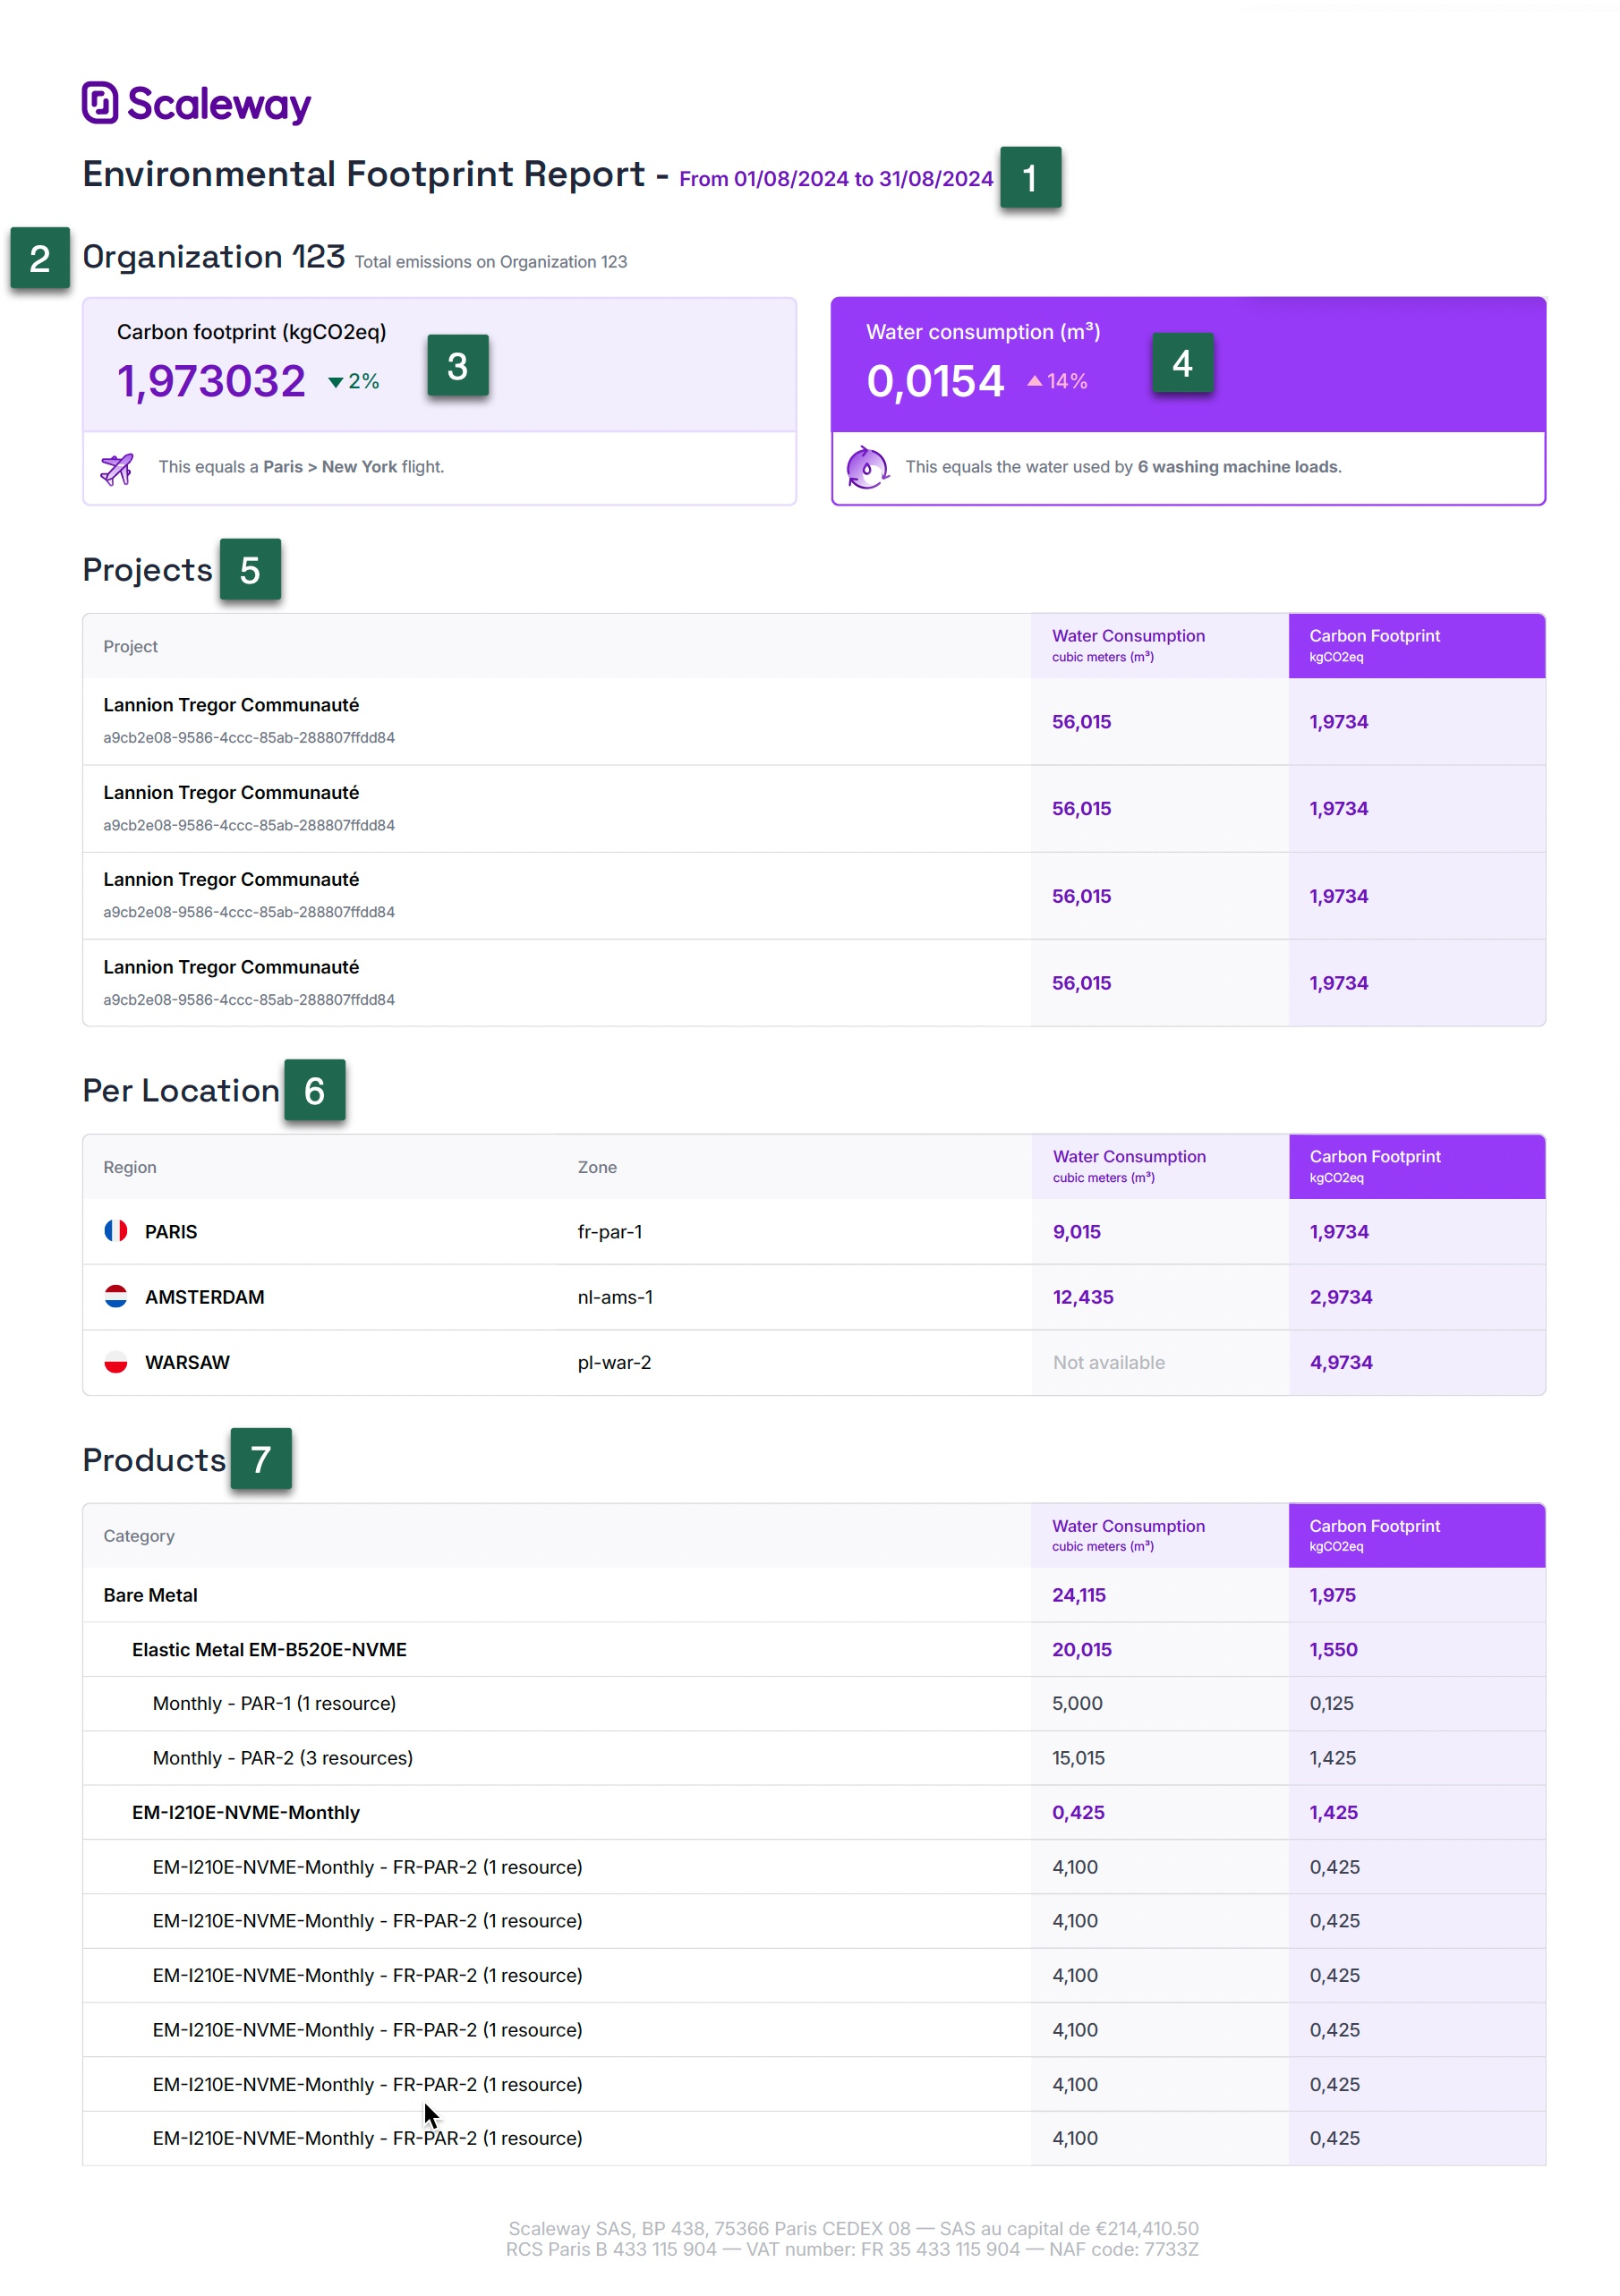
- 1. The start and end date of the period being tracked.
- 2. The name of your Organization.
- 3. The total carbon footprint of your Organization during the period being tracked, which takes into account the impact of the manufacture and use of all the components that run your active Scaleway products in relation to each service's useful life.
- 4. The total water consumption of your Organization during the period being tracked, which is calculated on the basis of the Water Usage Effectiveness (WUE) of the data centers in which each of your services are located, as well as the services' electricity consumption.
- 5. The total water consumption and carbon footprint of each of your Projects.
- 6. The total water consumption and carbon footprint per geographical location (region and Availability Zone)
- 7. The total water consumption and carbon footprint of each of your products.
For both the carbon emissions, and the water consumption, the power consumption of your active resources is used in the calculation. The way you use your resources has a direct impact on power consumption. Therefore, results may vary greatly from one month to another.
For example, if you start your Elastic Metal server on the 15th of the month and leave it running until the end of the month, the data will be calculated for the 15 days of use, not for the whole month. If you leave the server on, non-stop, in the following month, the impact data will be calculated for a full month.