Integrate Audit Trail with Splunk
Audit Trail supports sending event data to Splunk Enterprise and Splunk Cloud Platform for security monitoring, data visualization and analytics, and compliance reporting.
By centralizing Scaleway audit data within Splunk, security operations center (SOC) and cloud operations teams can address several operational and security use cases:
- User activity monitoring and access governance
- Change tracking and configuration management
- Compliance auditing and reporting (SOC 2, ISO 27001)
- Security incident investigation and forensics
- Anomaly detection and threat hunting
- Operational troubleshooting and root cause analysis
This guide explains how to integrate Scaleway Audit Trail with Splunk.
The integration consists of two components, both installable and configurable via Splunk:
- Scaleway Add‑on for Splunk – Collects Audit Trail events from your Scaleway infrastructure and forwards them securely to Splunk Enterprise/Cloud.
- Scaleway App for Splunk – Visualizes the ingested events with ready‑made dashboards and security analytics; you can also build custom dashboards.
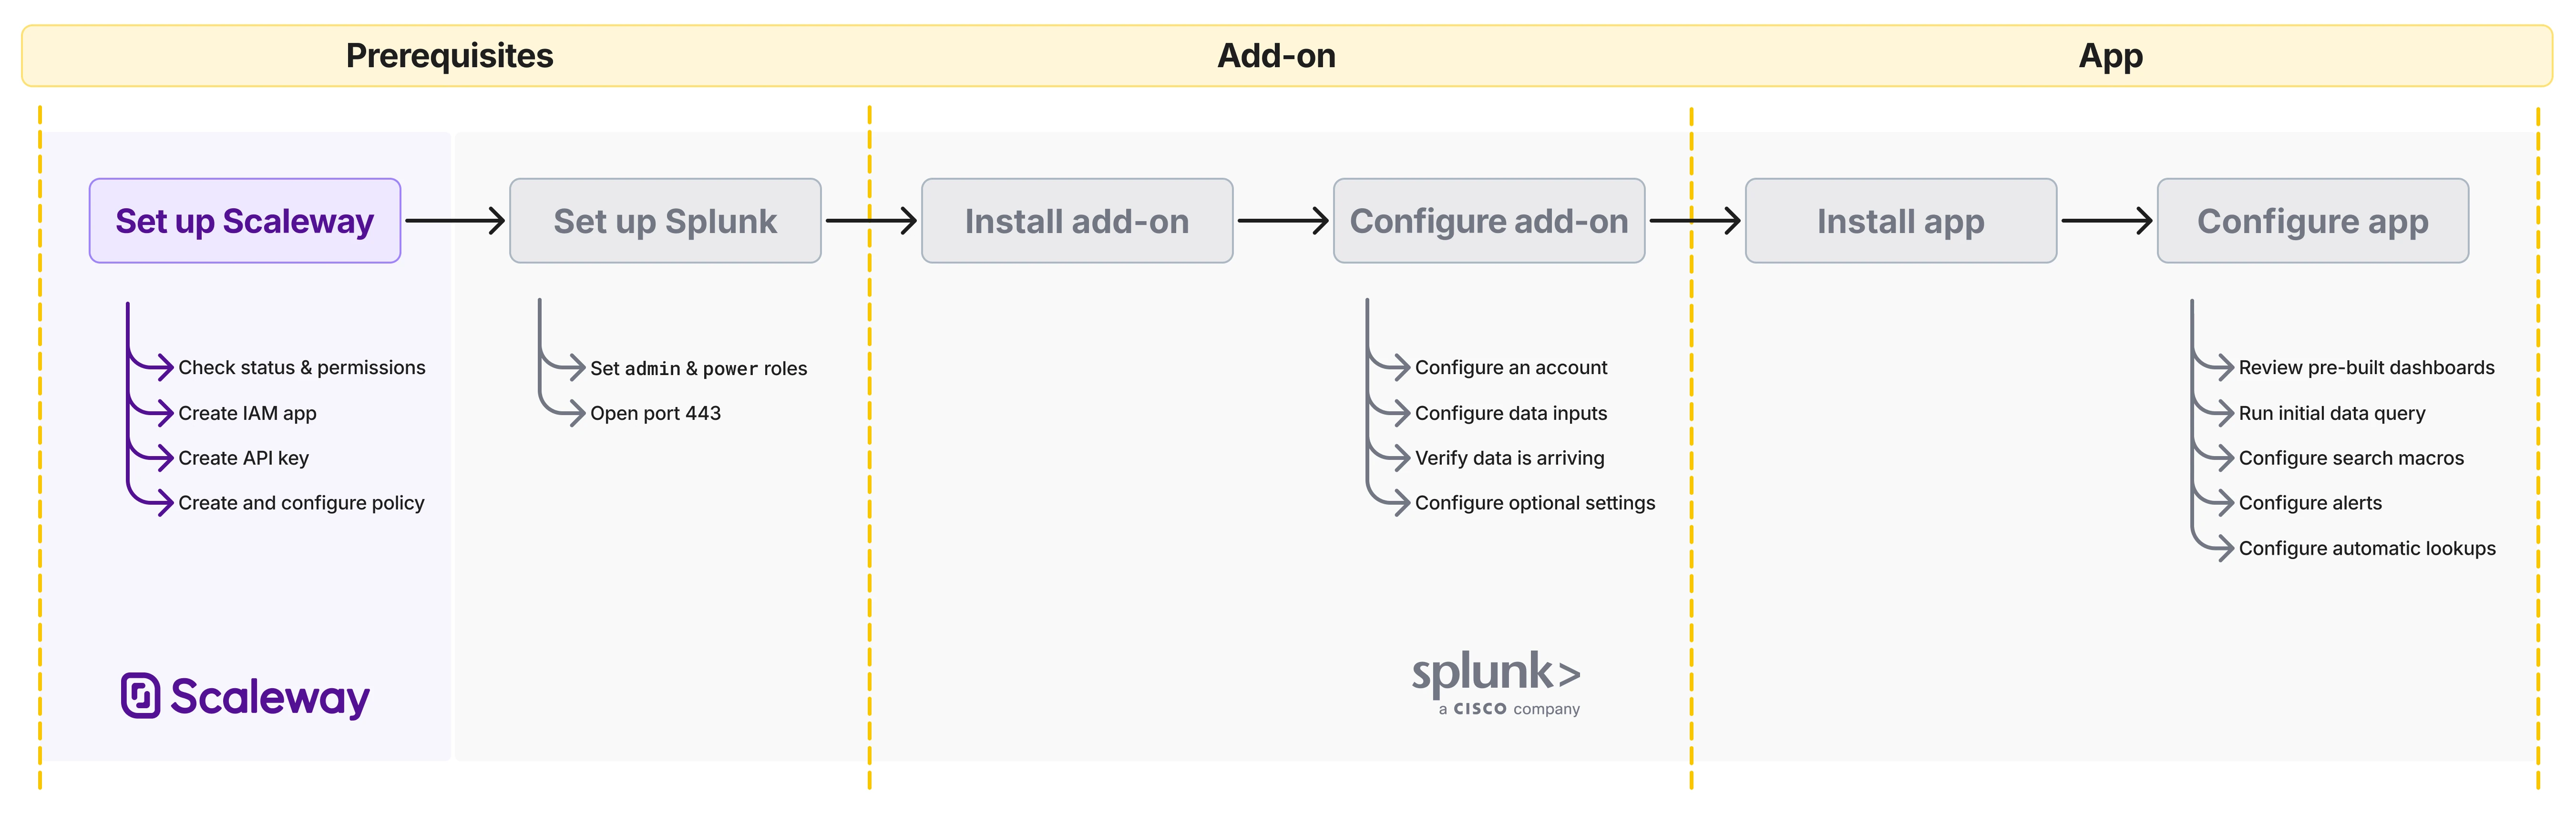
The following diagram outlines the steps required to set up your Splunk instance for ingesting Scaleway Audit Trail data.
Scaleway Add-on for Splunk
The Scaleway Add-on for Splunk acts as a data collection layer that ingests audit logs from Scaleway infrastructure into a Splunk deployment. It connects to Scaleway accounts via API credentials, allowing administrators to collect:
- audit events from the Scaleway Audit Trail service
- Identity and Access Management (IAM) logs covering users, groups, and applications
- event data about Compute resources
After the Splunk platform indexes the ingested information, the data can be analyzed directly or correlated with other data sources to provide enriched contextual insights.
To ensure compatibility across the Splunk ecosystem, the add-on extracts fields aligned with the Common Information Model (CIM). This standardized mapping allows the collected data to feed directly into Splunk Enterprise Security (ES), Splunk IT Service Intelligence (ITSI), or custom correlation searches and dashboards.
Before you start
To complete the actions presented below, you must have:
- A Scaleway account logged in to the console
- Owner status or IAM permissions allowing you to perform actions in the intended Organization
- API credentials (Access Key ID and Secret Key) with Audit Trail (and optionally IAM and Instance) read permissions. For details, see Configure an API key and permissions.
- Opened port 443 to allow the Scaleway Add-on to communicate with the Scaleway servers
- Splunk Enterprise or Splunk Cloud Platform (supported versions: 9.4.x, 10.0.x, 10.2.x, 10.4.x)
- The Splunk
adminrole assigned to you
Configure an API key and permissions
To start collecting data from the Scaleway Audit Trail, IAM, and Compute APIs using the add-on, you must generate an API key in the Scaleway console and assign the appropriate permissions.
- Go to the Scaleway console.
- Create a dedicated IAM application.
- Create an API key.
- When creating an API key, make a note of the following information. They will be needed later, when configuring an account in Splunk.
- Secret Key
- Organization ID
- Create a new IAM policy and attach that policy to the Scaleway application you have just created.
- Within the policy configuration, add the necessary rules to grant read-only access by defining the exact scope and permission sets. Since these services operate at different hierarchical levels, you need to configure the following distinct rules:
- Audit Trail & IAM: Set the scope to your Organization and select the AuditTrailReadOnly and IAMReadOnly permission sets.
- Instances: Set the scope to your specific Project (or Organization, if you want to monitor all projects) and select the InstancesReadOnly permission set.
Install the add-on
You can install the Scaleway Add-on via Splunk Web or the command line. The add-on is supported across all Splunk Enterprise and Splunk Cloud instance types, including indexers, search heads, and forwarders.
- Download the Scaleway Add-on from Splunkbase.
- Determine the best installation location and method for your deployment architecture.
- Complete any required prerequisite steps.
- Execute the installation.
For detailed instructions about how to install the add-on in a single-instance deployment, a distributed deployment, or Splunk Cloud, see the relevant sections in the Installing add-ons Splunk documentation:
For distributed environments, the next section provides additional information.
Installation in distributed environments
The following table provides guidance on where and how to install the add-on within distributed Splunk Enterprise environments or setups that rely on forwarders.
Note that based on your infrastructure, deployment preferences, and the specific requirements of the add-on, deployment across multiple Splunk instances may be necessary.
| Splunk instance type | Supported | Required | Comments |
|---|---|---|---|
| Search heads | Yes | Yes | Deploy the add‑on across all search heads that require Scaleway knowledge management capabilities. To centralize management, you must assign a single node (a search head or heavy forwarder) as the configuration server, and disable the visibility of the add-on on all secondary nodes. |
| Indexers | No | No | Installation is not required here. The add-on exclusively relies on modular inputs for data collection, meaning it must be deployed on a heavy forwarder. |
| Heavy forwarders | Yes | No | Installation on indexers is not required if the add‑on is already deployed on heavy forwarders. To centralize management, select one specific node (a search head or heavy forwarder) to serve as the configuration server, and disable the visibility of the add-on across all secondary locations. |
| Universal forwarders | No | No | Data collection via universal forwarders is unsupported. Because this add‑on utilizes modular inputs that depend on Python and the Splunk REST handler, a heavy forwarder is required. |
The following table provides a quick reference for the compatibility of the add-on with Splunk distributed deployment features.
| Distributed deployment feature | Supported | Comments |
|---|---|---|
| Search head clusters | Yes | Disable add‑on visibility on search heads. |
| Indexer clusters | Yes | This method is supported only for deploying the unconfigured add‑on. All configuration must be completed via the user interface of the add‑on on a single, designated node. |
| Deployment server | Yes | This method is supported only for deploying the unconfigured add‑on. All configuration must be completed via the user interface of the add‑on on a single, designated node. |
Configure the add-on
Configuring the add-on involves three main steps:
- Configure an account (a Scaleway Organization and corresponding API key).
- Configure inputs (i.e., data ingestion sources).
- Configure optional settings (add a proxy or change the log level).
Configure an account
Follow these steps to configure the Scaleway Add-on for Splunk:
- On your Splunk platform instance, go to the Splunk Web homepage, then select Scaleway Add-on in the navigation. The Configuration tab of the add-on opens.
- Configure an account. You must configure at least one account.
- On the Configuration tab, click the Accounts tab.
- Click the Add button. The Add Accounts window appears.
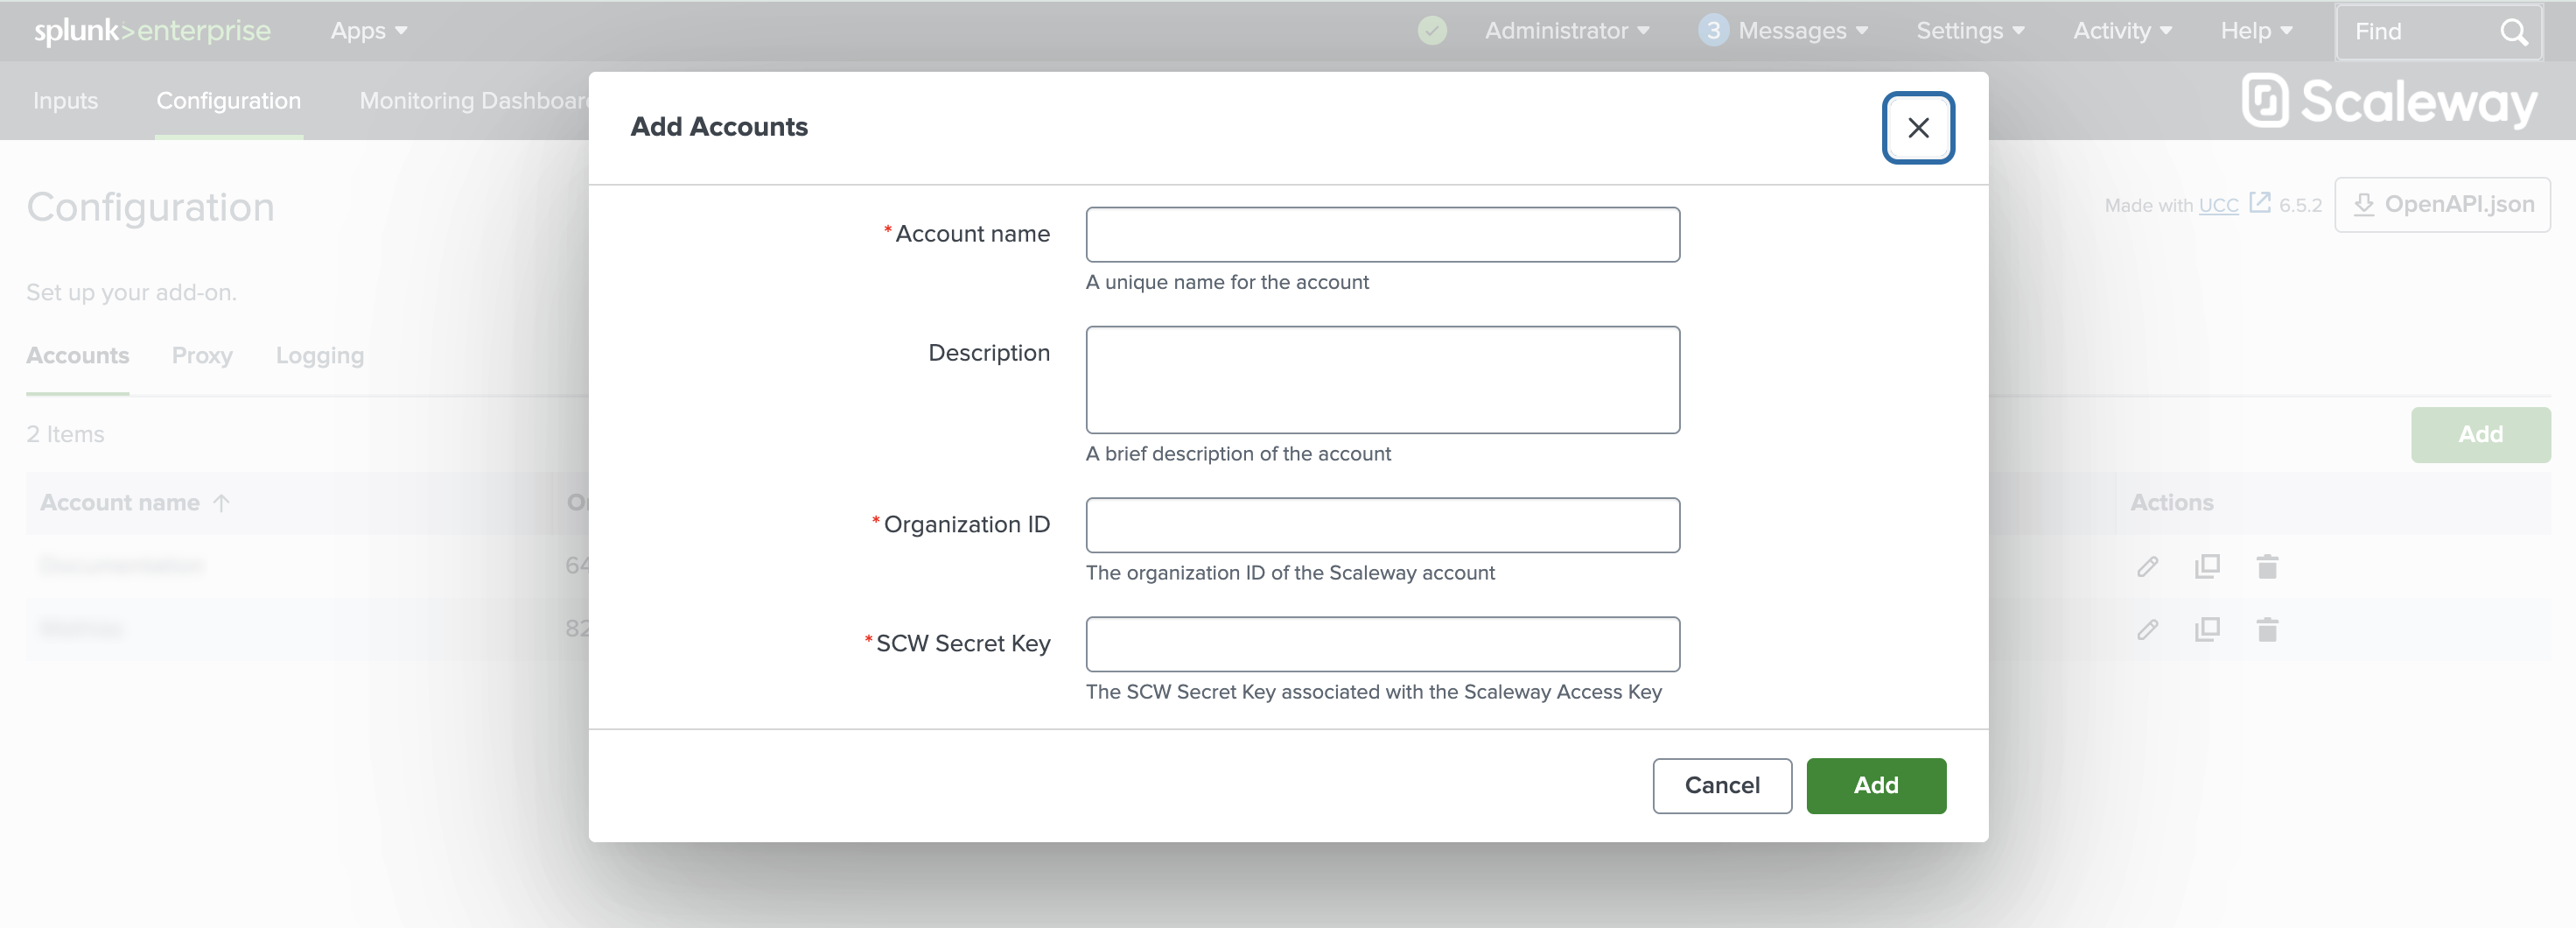
- Provide the required information in the fields marked with an asterisk:
- Account name: Any descriptive name that helps you identify the account.
- Organization ID: The identifier of the Scaleway Organization associated with the Scaleway API key. You can retrieve your Organization ID from the Scaleway console: select Organization Dashboard in the side menu, then click Copy ID.
- SCW Secret Key: The API Secret Key that your Scaleway account will use to authenticate to Splunk. This is the Secret Key that was shown to you when you created your Scaleway API key in the Scaleway console.
- Repeat these steps for all the Organizations that you want Splunk to collect data from.
To complete the setup of the add-on, after configuring an account, you must specify one or more inputs (i.e., data ingestion sources).
Configure an input
A Splunk input is a data ingestion source that brings raw data into the Splunk platform.
To complete the setup of the add-on, you must configure data inputs on the specific Splunk node handling data collection for the add-on (usually a heavy forwarder). Scaleway recommends using Splunk Web for this configuration, but it is also possible to configure inputs manually via a configuration file.
Once the inputs are configured, the Scaleway Add-on continuously polls Scaleway Audit Trail APIs at the specified intervals and forwards events to Splunk for indexing and analysis.
To retrieve Audit Trail events/IAM logs/Instance server events for a Scaleway Organization and/or Project, complete the following steps.
-
On your Splunk platform instance, go to the Splunk Web homepage, then select Scaleway Add-on in the navigation.
-
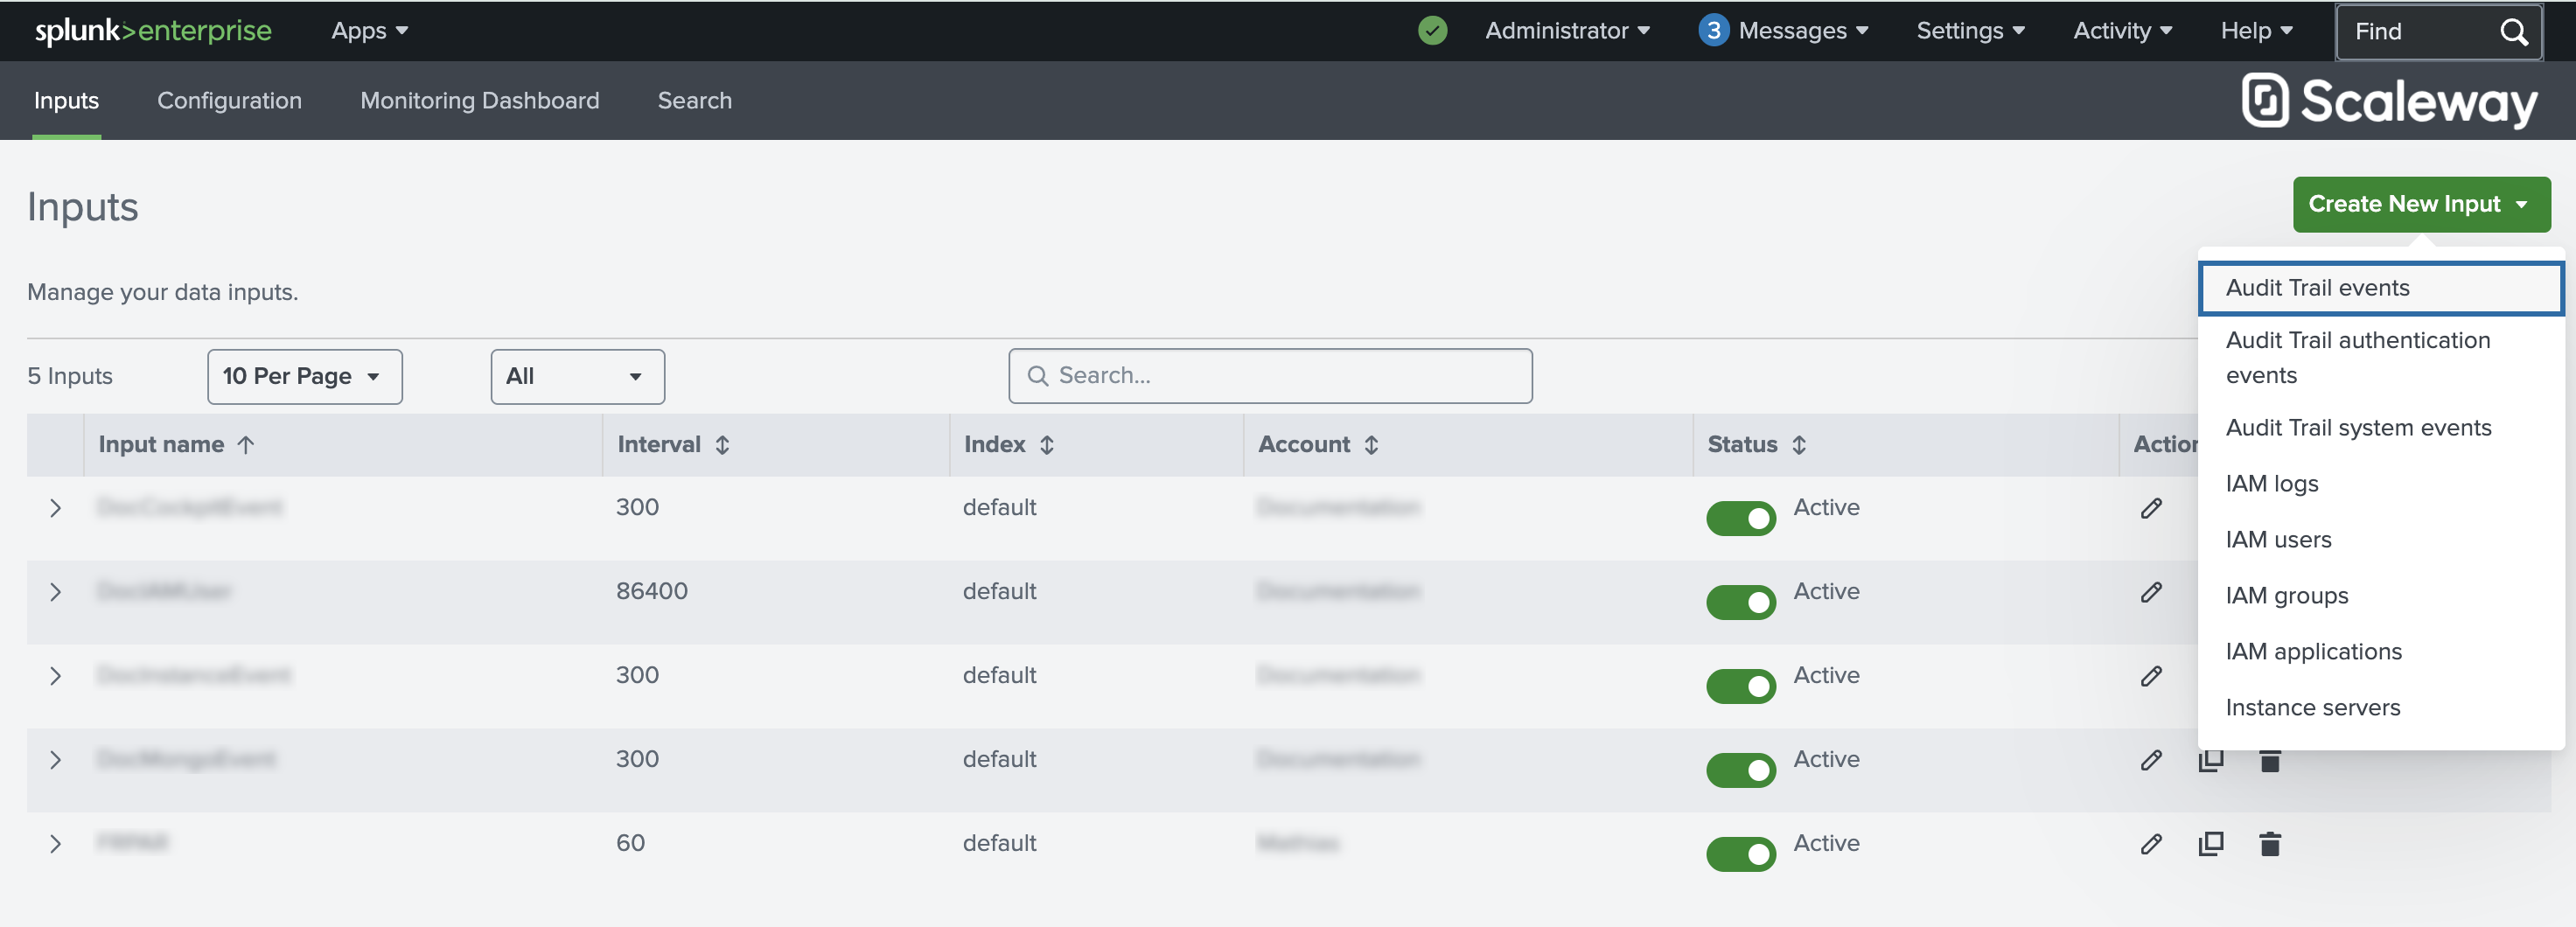
Go to the Inputs tab and click the Create New Input button.
-
Select the relevant input type from the dropdown.
Input type Queried Scaleway endpoint Audit Trail events /audit-trail/v1alpha1/regions/{region}/events Audit Trail authentication events /audit-trail/v1alpha1/regions/{region}/authentication-events Audit Trail system events /audit-trail/v1alpha1/regions/{region}/system-events IAM logs /iam/v1alpha1/logs IAM users /iam/v1alpha1/users IAM groups /iam/v1alpha1/groups IAM applications /iam/v1alpha1/applications Instance servers /instance/v1/zones/{zone}/servers A window appears prompting you to enter details for your input.
-
Provide the required information (e.g., polling interval, Scaleway region). Obligatory fields are marked with an asterisk.
Note that:
-
The minimum allowed polling Interval is 1 poll every 60 seconds.
-
The Index must correspond to the index in which the Audit Trail events data should be stored. The default is
main. -
The Project ID field is optional. If no Project ID is specified, the input will retrieve data from all the Scaleway Projects.
To retrieve your Project ID, go to the Scaleway console, select Project Dashboard in the side menu, then click Copy ID.
-
The Product name field is optional. If no product name is specified, the input will retrieve data from all the Scaleway products.
To retrieve a product name, go to the Scaleway console and select Monitoring > Audit Trail in the side menu. Use the product name as displayed in the Product dropdown on the Events tab. However, make sure that you use lowercase letters only (for example,
instance) and omit the copyright sign from the name.
-
-
Verify that data is successfully arriving by running the following search on your search head.
Input type Search to run Audit Trail events sourcetype=scaleway:audittrail_events*Audit Trail authentication events sourcetype=scaleway:audittrail_authentication_eventsAudit Trail system events sourcetype=scaleway:audittrail_system_eventsIAM logs sourcetype=scaleway:iam:logsIAM users sourcetype=scaleway:iam:usersIAM groups sourcetype=scaleway:iam:groupsIAM applications sourcetype=scaleway:iam:applicationsInstance servers sourcetype=scaleway:instanceIf you do not see any events, check the Troubleshooting tab on your data collection node to verify that your accounts, forwarders, and inputs are all configured successfully.
Configure optional proxy and log level settings
You can configure optional proxy and log level settings on the Splunk platform instance that you have designated as your configuration server for the add-on.
The Scaleway Add-on supports HTTP/SOCKS proxies.
- On your Splunk platform instance, go to the Splunk Web homepage, then select Scaleway Add-on in the navigation. The Configuration tab of the add-on opens.
- If you need to use a proxy:
- Click the Proxy tab.
- Check the Enable box.
- Add your proxy details. If your proxy server does not require authentication, leave the Username and Password fields empty.
- Click Save.
- If you want to change the logging level:
- Click the Logging tab.
- Select the Log Level.
- Click Save.
Upgrade the add-on
To upgrade the add-on, complete the following steps.
- Disable all inputs.
- Download the latest version of the Scaleway Add-on from Splunkbase.
- Install the add-on across your deployment.
- Enable all the configured inputs to resume the data collection.
Troubleshoot the add-on
For details, see I have issues with my Splunk integration.
Scaleway App for Splunk
The Scaleway App for Splunk is a visualization layer built for Scaleway Audit Trail data. While the add-on handles raw data collection, the application provides pre-built dashboards for security monitoring, with the option to create custom dashboards. It also records user access patterns and maintains chronological logs of resource changes to assist with event correlation. Built-in alerting logic notifies administrators about dropped events or security anomalies.
Before you start
To complete the actions presented below, you must have:
- Splunk Enterprise or Splunk Cloud Platform (supported versions: 9.4.x, 10.0.x, 10.2.x, 10.4.x)
- The Splunk
adminrole assigned to you for installing the app - At least the Splunk
powerrole assigned to you for configuring the app - Installed and configured Scaleway Add-on for Splunk
- Audit Trail data flowing into Splunk
Install the app
You can install the Scaleway App via Splunk Web or the command line. Note that the app is supported only on search head instances.
- Download the Scaleway App from Splunkbase.
- Determine the best installation method for your deployment architecture.
- Complete any required prerequisite steps.
- Execute the installation.
For detailed instructions about how to install the app in a single-instance deployment, a distributed deployment, or Splunk Cloud, see the relevant sections in the Installing add-ons Splunk documentation:
For distributed environments, the next section provides additional information.
Installation in distributed environments
The following table provides guidance on where and how to install the app within distributed Splunk Enterprise environments.
| Splunk instance type | Supported | Required | Comments |
|---|---|---|---|
| Search heads | Yes | Yes | Deploy the app across all search heads. |
| Indexers | No | No | Installation is not required here. |
| Heavy forwarders | No | No | Installation is not required here. |
| Universal forwarders | No | No | Installation is not required here. |
The following table provides a quick reference for the compatibility of the app with Splunk distributed deployment features.
| Distributed deployment feature | Supported | Comments |
|---|---|---|
| Search head clusters | Yes | The application needs to be pushed on all your search head instances using the Search Head Deployer component. |
| Indexer clusters | No | n/a |
| Deployment server | No | n/a |
Configure the app
Once the app has been installed, you can:
- Review pre-built dashboards
- Perform an initial data query
- Configure search macros
- Configure and enable alerts
- Configure automatic lookups, such as an identity lookup, a group lookup, an application lookup, or an asset lookup
Review pre-built dashboards
To access the pre-built dashboards, access Splunk and go to Apps > Scaleway App. The Scaleway - Data pipeline health status dashboard opens.
To switch between dashboards, use the side menu.
The following pre-built dashboards are available:
- Scaleway - Data pipeline health status: Displays data ingestion and event count metrics, as well as errors for the Scaleway audit data feed
- Scaleway - Authentication monitoring: Tracks login events, session details, credential usage, with options to filter by user
- Scaleway - Activity monitoring: Focuses on dividing views between account management actions (such as account creation, update, and deletion) and asset management events (such as methods used, successful and failed operations)
Perform an initial data query
To perform an initial query on the data ingested from your Scaleway infrastructure, follow these steps:
- Access the Scaleway App in Splunk, and click Search in the side menu.
- Enter a search query in the Search field. To formulate your queries, use the Splunk Search Processing Language (SPL).
The source types are automatically assigned, but when running a search query, the following sourcetype information can be useful. The Scaleway Add-on provides the index-time and search-time knowledge for audit events in the following formats.
| Source type | Dataset name | Description | CIM data model |
|---|---|---|---|
scaleway:audittrail_events | All_Changes All_Changes.Account_Management All_Changes.Instance_Changes | All Audit Trail events visible through the Scaleway Audit Trail portal. | Change |
scaleway:audittrail_events:auths | Authentication | All unauthenticated API events that actually perform and/or complete an authentication step. | Authentication |
scaleway:audittrail_authentication_events | n/a | All Audit Trail authentication events. | n/a |
scaleway:audittrail_system_events | n/a | All Audit Trail system events. | n/a |
scaleway:iam:logs | All_Changes All_Changes.Account_Management | All logs available for given Organization. | Change |
scaleway:iam:users | n/a | All users available for given Organization. | n/a |
scaleway:iam:groups | n/a | All groups available for given Organization. | n/a |
scaleway:iam:applications | n/a | All applications available for given Organization. | n/a |
scaleway:instance | n/a | All instances available for given Availability Zone. | n/a |
Configure search macros
The app relies on search macros to simplify the setup of dashboards, alerts, and reports. To learn more about search macros, see Use search macros in searches in the Splunk documentation.
The scaleway_index macro is used by the Scaleway App to reference the Splunk index where Scaleway events are stored. By default, the scaleway_index macro points to the main index.
Configure and enable alerts
The Scaleway App allows you to configure alerts to monitor:
- Spikes in error rates compared to the previous day by enabling the "Scaleway - Increased number of errors from yesterday" alert.
- Increases in failed login attempts by enabling the "Scaleway - Increased number of failed logins" alert.
- Interruptions in data ingestion by enabling the "Scaleway - No data ingesting in the last hour" alert.
Prerequisites:
- Since the "Scaleway - Increased number of failed logins" alert relies on logs with
sourcetype=scaleway:audittrail_events:auths, ensure that the corresponding data input is enabled in the Scaleway Add-on. - Configure search macros.
Steps:
- Configure alerts:
- Go to Splunk Web > Splunk Search Head, and click Settings > Searches, reports, and alerts.
- Set a filter for the Scaleway App (DA-scaleway_app).
- Click the alert that you want to configure.
- In the Send email section, customize the settings according to your preferences.
- Click Save.
- Enable alerts:
- Go to Splunk Web > Splunk Search Head, and click Settings > Searches, reports, and alerts.
- Set a filter for the Scaleway App (DA-scaleway_app).
- Click Edit next to the alert you want to enable.
- Click Enable.
Configure automatic identity lookup
The Scaleway App allows users to automate the population of the scaleway_identities lookup by enabling the "Scaleway - Populate identity lookup" report. This lookup automatically enriches events ingested via the Scaleway Add-on with user data context.
Prerequisites:
- Since the report relies on logs with
sourcetype=scaleway:iam:users, ensure that the corresponding data input is enabled in the Scaleway Add-on. - Configure search macros.
- The configuration of this mechanism requires Splunk Enterprise Security.
Enable the report:
Use Splunk Web to enable the "Scaleway - Populate identity lookup" report.
- In the Splunk Search Head, click Settings > Searches, reports, and alerts.
- Set a filter for the Scaleway App (DA-scaleway_app).
- Click the Scaleway - Populate identity lookup report.
- Set Earliest time and Latest time according to your needs:
- If you are receiving the
scaleway:iam:usersevents once per day, set Earliest time to -24h@h and Latest time to now. - If you are receiving the
scaleway:iam:usersevents once per week, set Earliest time to -7d@d and Latest time to now.
- If you are receiving the
- Click Save.
Schedule the report:
Use Splunk Web to schedule the "Scaleway - Populate identity lookup" report.
- In the Splunk Search Head, click Settings > Searches, reports, and alerts.
- Set a filter for the Scaleway App (DA-scaleway_app).
- Click Edit > Edit Schedule > Enable and Schedule Report to edit the Scaleway - Populate identity lookup report.
- Set the scheduling according to your needs.
- Click Save.
Configure Splunk Enteprise Security:
To allow Splunk Enterprise Security to enrich logs using the scaleway_identities lookup, you must configure the following settings:
- Open the Splunk Enterprise Security application.
- Click Configure > All configurations > Assets and identities > Identity lookups.
- Click New > New configuration.
- As Source, select the scaleway_identities lookup.
- Add a name.
- Add a category (a short descriptive category for this identity list, for example: 'scaleway_identities').
- Add a description.
- Click Save.
Configure automatic group lookup
The Scaleway App allows users to automate the population of the scaleway_groups lookup by enabling the "Scaleway - Populate group lookup" report. This lookup automatically enriches events ingested via the Scaleway Add-on with group data context.
Prerequisites:
- Since the report relies on logs with
sourcetype=scaleway:iam:groups, ensure that the corresponding data input is enabled in the Scaleway Add-on. - Configure search macros.
Enable the report:
Use Splunk Web to enable the "Scaleway - Populate group lookup" report.
- In the Splunk Search Head, click Settings > Searches, reports, and alerts.
- Set a filter for the Scaleway App (DA-scaleway_app).
- Click the Scaleway - Populate group lookup report.
- Set Earliest time and Latest time according to your needs:
- If you are receiving the
scaleway:iam:groupsevents once per day, set Earliest time to -24h@h and Latest time to now. - If you are receiving the
scaleway:iam:groupsevents once per week, set Earliest time to -7d@d and Latest time to now.
- If you are receiving the
- Click Save.
Schedule the report:
Use Splunk Web to schedule the "Scaleway - Populate group lookup" report.
- In the Splunk Search Head, click Settings > Searches, reports, and alerts.
- Set a filter for the Scaleway App (DA-scaleway_app).
- Click Edit > Edit Schedule > Enable and Schedule Report to edit the Scaleway - Populate group lookup report.
- Set the scheduling according to your needs.
- Click Save.
Configure automatic application lookup
The Scaleway App allows you to automate the population of the scaleway_applications lookup by enabling the "Scaleway - Populate application lookup" report. This lookup automatically enriches events ingested via the Scaleway Add-on with application data context.
Prerequisites:
- Since the report relies on logs with
sourcetype=scaleway:iam:applications, ensure that the corresponding data input is enabled in the Scaleway Add-on. - Configure search macros.
Enable the report:
Use Splunk Web to enable the "Scaleway - Populate application lookup" report.
- In the Splunk Search Head, click Settings > Searches, reports, and alerts.
- Set a filter for the Scaleway App (DA-scaleway_app).
- Click the Scaleway - Populate application lookup report.
- Set Earliest time and Latest time according to your needs:
- If you are receiving the
scaleway:iam:applicationsevents once per day, set Earliest time to -24h@h and Latest time to now. - If you are receiving the
scaleway:iam:applicationsevents once per week, set Earliest time to -7d@d and Latest time to now.
- If you are receiving the
- Click Save.
Schedule the report:
Use Splunk Web to schedule the "Scaleway - Populate application lookup" report.
- In the Splunk Search Head, click Settings > Searches, reports, and alerts.
- Set a filter for the Scaleway App (DA-scaleway_app).
- Click Edit > Edit Schedule > Enable and Schedule Report to edit the Scaleway - Populate application lookup report.
- Set the scheduling according to your needs.
- Click Save.
Configure automatic asset lookup
The Scaleway App allows you to automate the population of the scaleway_assets lookup by enabling the "Scaleway - Populate asset lookup" report. This lookup automatically enriches events ingested via the Scaleway Add-on with asset data context.
Prerequisites:
- Since the report relies on logs with
sourcetype=scaleway:instance, ensure that the corresponding data input is enabled in the Scaleway Add-on. - Configure search macros.
- The configuration of this mechanism requires Splunk Enterprise Security.
Enable the report:
Use Splunk Web to enable the "Scaleway - Populate asset lookup" report.
- In the Splunk Search Head, click Settings > Searches, reports, and alerts.
- Set a filter for the Scaleway App (DA-scaleway_app).
- Click the Scaleway - Populate asset lookup report.
- Set Earliest time and Latest time according to your needs:
- If you are receiving the
scaleway:instanceevents once per day, set Earliest time to -24h@h and Latest time to now. - If you are receiving the
scaleway:instanceevents once per week, set Earliest time to -7d@d and Latest time to now.
- If you are receiving the
- Click Save.
Schedule the report:
Use Splunk Web to schedule the "Scaleway - Populate asset lookup" report.
- In the Splunk Search Head, click Settings > Searches, reports, and alerts.
- Set a filter for the Scaleway App (DA-scaleway_app).
- Click Edit > Edit Schedule > Enable and Schedule Report to edit the Scaleway - Populate asset lookup report.
- Set the scheduling according to your needs.
- Click Save.
Configure Splunk Enteprise Security:
To allow Splunk Enterprise Security to enrich logs using the scaleway_assets lookup, you must configure the following settings:
- Open the Splunk Enterprise Security application.
- Click Configure > All configurations > Assets and identities > Asset lookups.
- Click New > New configuration.
- As Source, select the scaleway_assets lookup.
- Add a name.
- Add a category (a short descriptive category for this identity list, for example: 'scaleway_assets').
- Add a description.
- Click Save.
Upgrade the app
To upgrade the app, complete the following steps.
- Download the latest version of the Scaleway App from Splunkbase.
- Install the app across your deployment.
Troubleshoot the app
For details, see I have issues with my Splunk integration.
Appendix: Manual input configuration
While Scaleway recommends using Splunk Web for configuring inputs (i.e., data ingestion sources) for the add-on, it is also possible to configure inputs manually via a configuration file.
Manually configure Audit Trail inputs
To manually configure Audit Trail inputs using a configuration file, complete the following steps.
-
Create a
$SPLUNK_HOME/etc/apps/TA-scaleway_addon/local/inputs.confconfiguration file (if it is not already present). -
Add the following stanza.
-
(Optional) Configure a custom
index. -
Restart your Splunk platform instance.
-
Verify that data is successfully arriving by running a search on your search head. For the search relevant to your input, see section Configure an input and the table that lists input types and corresponding searches.
If you do not see any events, check the Troubleshooting tab on your data collection node to verify that your accounts, forwarders, and inputs are all configured successfully.
Manually configure IAM inputs
To manually configure IAM inputs using a configuration file, complete the following steps.
-
Create a
$SPLUNK_HOME/etc/apps/TA-scaleway_addon/local/inputs.confconfiguration file (if it is not already present). -
Add the following stanza.
-
(Optional) Configure a custom
index. -
Restart your Splunk platform instance.
-
Verify that data is successfully arriving by running a search on your search head. For the search relevant to your input, see section Configure an input and the table that lists input types and corresponding searches.
If you do not see any events, check the Troubleshooting tab on your data collection node to verify that your accounts, forwarders, and inputs are all configured successfully.
Manually configure Instance server inputs
To manually configure Instance server using a configuration file, complete the following steps.
-
Create a
$SPLUNK_HOME/etc/apps/TA-scaleway_addon/local/inputs.confconfiguration file (if it is not already present). -
Add the following stanza.
[instance_servers://<instance_servers_input_name>] interval = <value> index = <value> account = <value> zone = <value> -
(Optional) Configure a custom
index. -
Restart your Splunk platform instance.
-
Verify that data is successfully arriving by running a search on your search head. For the search relevant to your input, see section Configure an input and the table that lists input types and corresponding searches.
If you do not see any events, check the Troubleshooting tab on your data collection node to verify that your accounts, forwarders, and inputs are all configured successfully.