Send metrics to Cockpit using Grafana Alloy
The Grafana Alloy agent is a component used in observability and monitoring setups, to collect and send metrics, logs, and traces from your applications, services, and infrastructure to observability platforms, such as Cockpit.
This page shows you how to configure the Grafana Alloy agent to push your metrics from a Scaleway Instance and visualize them in Grafana. You can also use this tutorial to push your data from Scaleway resources or external/custom resources.
For the sake of this documentation, we are using Grafana Alloy on an Ubuntu instance. Refer to the official Grafana documentation (External link) to find the commands to use depending on your operating system of choice.
Before you start
To complete the actions presented below, you must have:
- Owner status or IAM permissions allowing you to perform actions in the intended Organization
- A Scaleway account logged into the console (External link)
- Created a custom data source of the metrics type
- Created an IAM application with an API key and assigned it an IAM policy with the
ObservabilityFullAccesspermission set. For detailed instructions, see Create an API secret key.
Create an API secret key
Your Grafana Alloy configuration must include the X-Auth-Token header with your Scaleway API secret key.
Follow these steps to create your API secret key:
- Create an IAM application.
- Create a policy, making sure that:
- When selecting the principal type, you choose the application you created in step 1.
- When adding rules, you select the Resource management > Cockpit > ObservabilityFullAccess permission set.
- Go back to your IAM application, select the API keys tab, and click Generate an API key.
- In the Generate an API keys dialog box that appears:
- Provide an optional key description, and select a key expiration time.
- Leave the Object Storage as No, skip for now.
- Click Generate API key. A screen appears showing the access key and secret key for your new API key. Save the secret key in a secure place, it will not be shown again after closing the screen.
Create your Instance and install Grafana Alloy
-
In the Scaleway console side menu, go to Compute > CPU & GPU Instances, and create an Instance.
-
Open a terminal and execute the following command to connect to your Instance. You can retrieve the public IP address of your Instance from the Overview page > Public Network section of the Instance.
ssh root@<YOUR_INSTANCE_PUBLIC_IP> -
Install Grafana Alloy (External link) on the Instance.
Configure Grafana Alloy to send metrics to Prometheus
- Create a folder named
configon the Instance. - Inside the
configfolder, create a file namedcockpit.alloy. - Paste the following template inside
cockpit.alloy:prometheus.exporter.unix "node" { set_collectors = [ "uname", "cpu", "cpufreq", "loadavg", "meminfo", "filesystem", "netdev", ] } prometheus.scrape "node" { scrape_interval = "60s" scrape_timeout = "4s" targets = prometheus.exporter.unix.node.targets forward_to = [prometheus.remote_write.cockpit.receiver] } prometheus.remote_write "cockpit" { endpoint { url = "https://xxxxxxxx-xxxx-xxxx-xxxx-xxxxxxxxxxxx.metrics.cockpit.<REGION>.scw.cloud/api/v1/push" headers = { "X-Auth-Token" = "API_SECRET_KEY", } } } - Replace
https://xxxxxxxx-xxxx-xxxx-xxxx-xxxxxxxxxxxx.metrics.cockpit.<REGION>.scw.cloud/api/v1/pushwith your metrics URL. You can retrieve it from the Scaleway console, from Monitoring > Cockpit > Data sources tab. - Replace
API_SECRET_KEYwith the secret key of your API key, then save your changes. - Open a terminal and start Alloy (External link):
alloy - In the same terminal, run the following command.
The last two lines of your output should look similar to the following.
alloy run config/cockpit.alloyts=2026-01-23T14:23:05.542081Z level=info msg="now listening for http traffic" service=http addr=127.0.0.1:12345 ts=2026-01-23T14:23:13.432896Z level=info msg="Done replaying WAL" component_path=/ component_id=prometheus.remote_write.cockpit subcomponent=rw remote_name=aa0551 url=https://xxxxxxxx-xxxx-xxxx-xxxx-xxxxxxxxxxxx.metrics.cockpit.fr-par.scw.cloud/api/v1/push duration=12.900498616s
Visualize your metrics
-
In the console (External link) side menu, click Monitoring > Cockpit. The Cockpit overview page opens.
-
Click Access Grafana to open your preconfigured dashboards in Grafana. You are redirected to the Grafana website.
-
Log in to your Grafana account. The Grafana overview page opens.
-
Click Dashboards, then click the New side menu. A dropdown appears.
-
Click Import to import a dashboard.
-
In the Find and import dashboards for common applications at grafana.com/dashboards field, enter
1860, then click Load.1860is the ID of the Node Exporter Full dashboard (External link) provided by Grafana. -
Enter a name for your dashboard or use the default name.
-
In the Folder field, select a folder in which to store your dashboard.
-
Click Import. Your dashboard loads and opens.
-
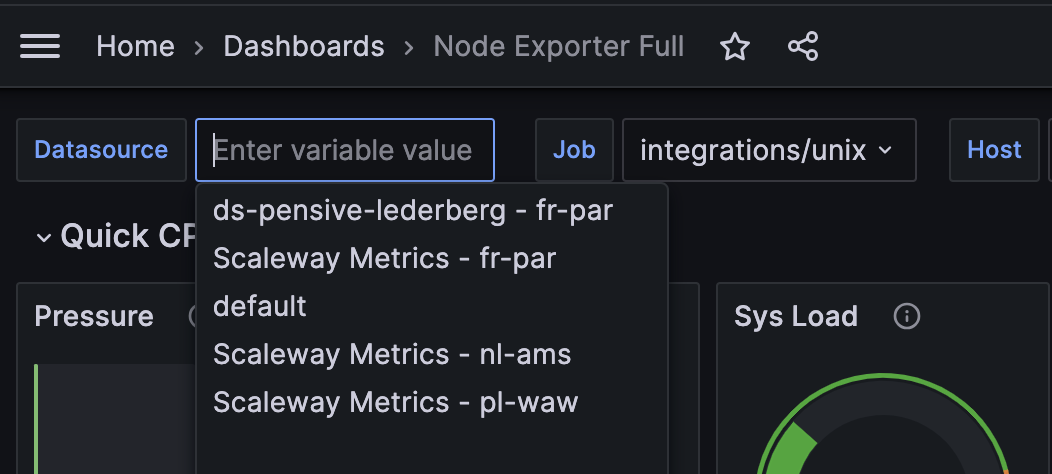
In the Datasource field, select the data source of your metrics from the dropdown.
-
By default, your dashboard retrieves the data of your data source from the last 24 hours. If your data source was created less than 24 hours ago, click the clock icon and adjust the time range to match its creation time.
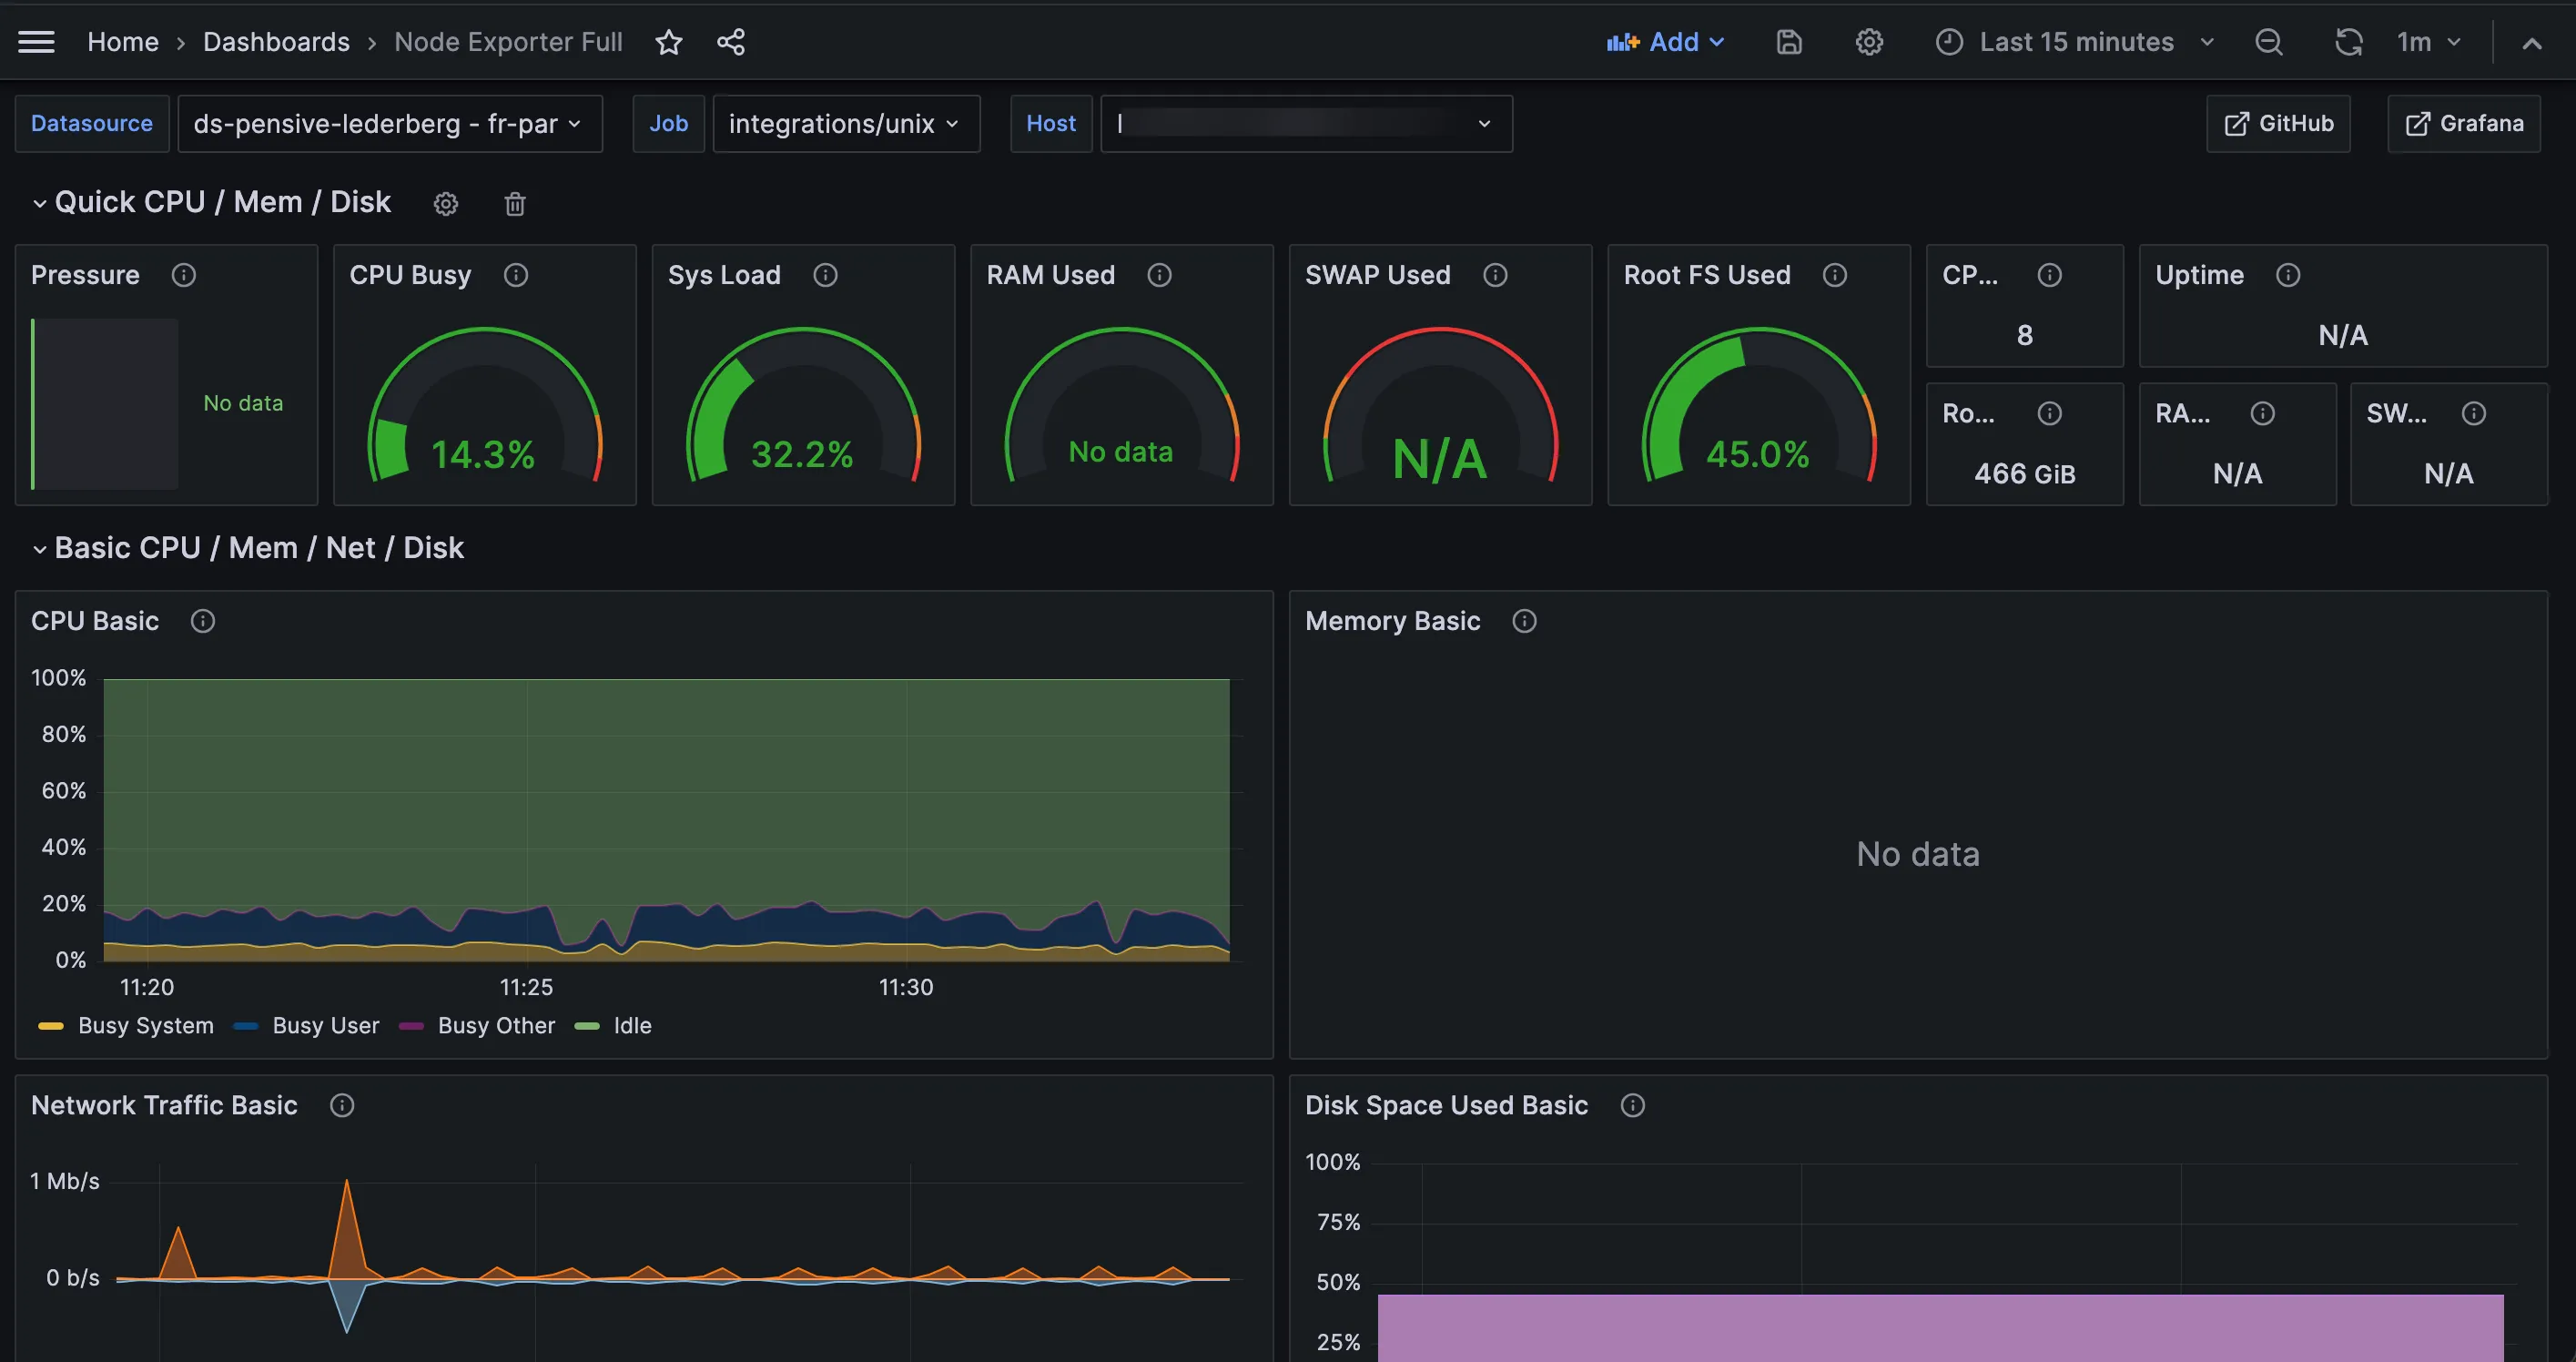
Your dashboard should look similar to the one in the following screenshot.